Using the Map on the PolicyMap for Salesforce App
 Updated
by
PolicyMap
Updated
by
PolicyMap
The PolicyMap for Salesforce App brings powerful location intelligence directly into your Salesforce environment. The app enriches your Accounts, Opportunities, Leads, and Custom Objects with demographic, housing, and health data—providing valuable context about the communities where your clients and prospects are located.
The interactive map in the app gives users access to the complete dataset for the curated data package, as well as many of the custom mapping features available in the flagship tool at www.policymap.com.
PolicyMap Data and Map
- Use the Location Search bar to find an address or place, such as a zip code, city, or county. This allows users to look at an address not in your Salesforce and review data on the fly.

- The drop-down menu in the Search bar changes the search to pre-define geographies like Census Tract, Block Group, School District, and more.
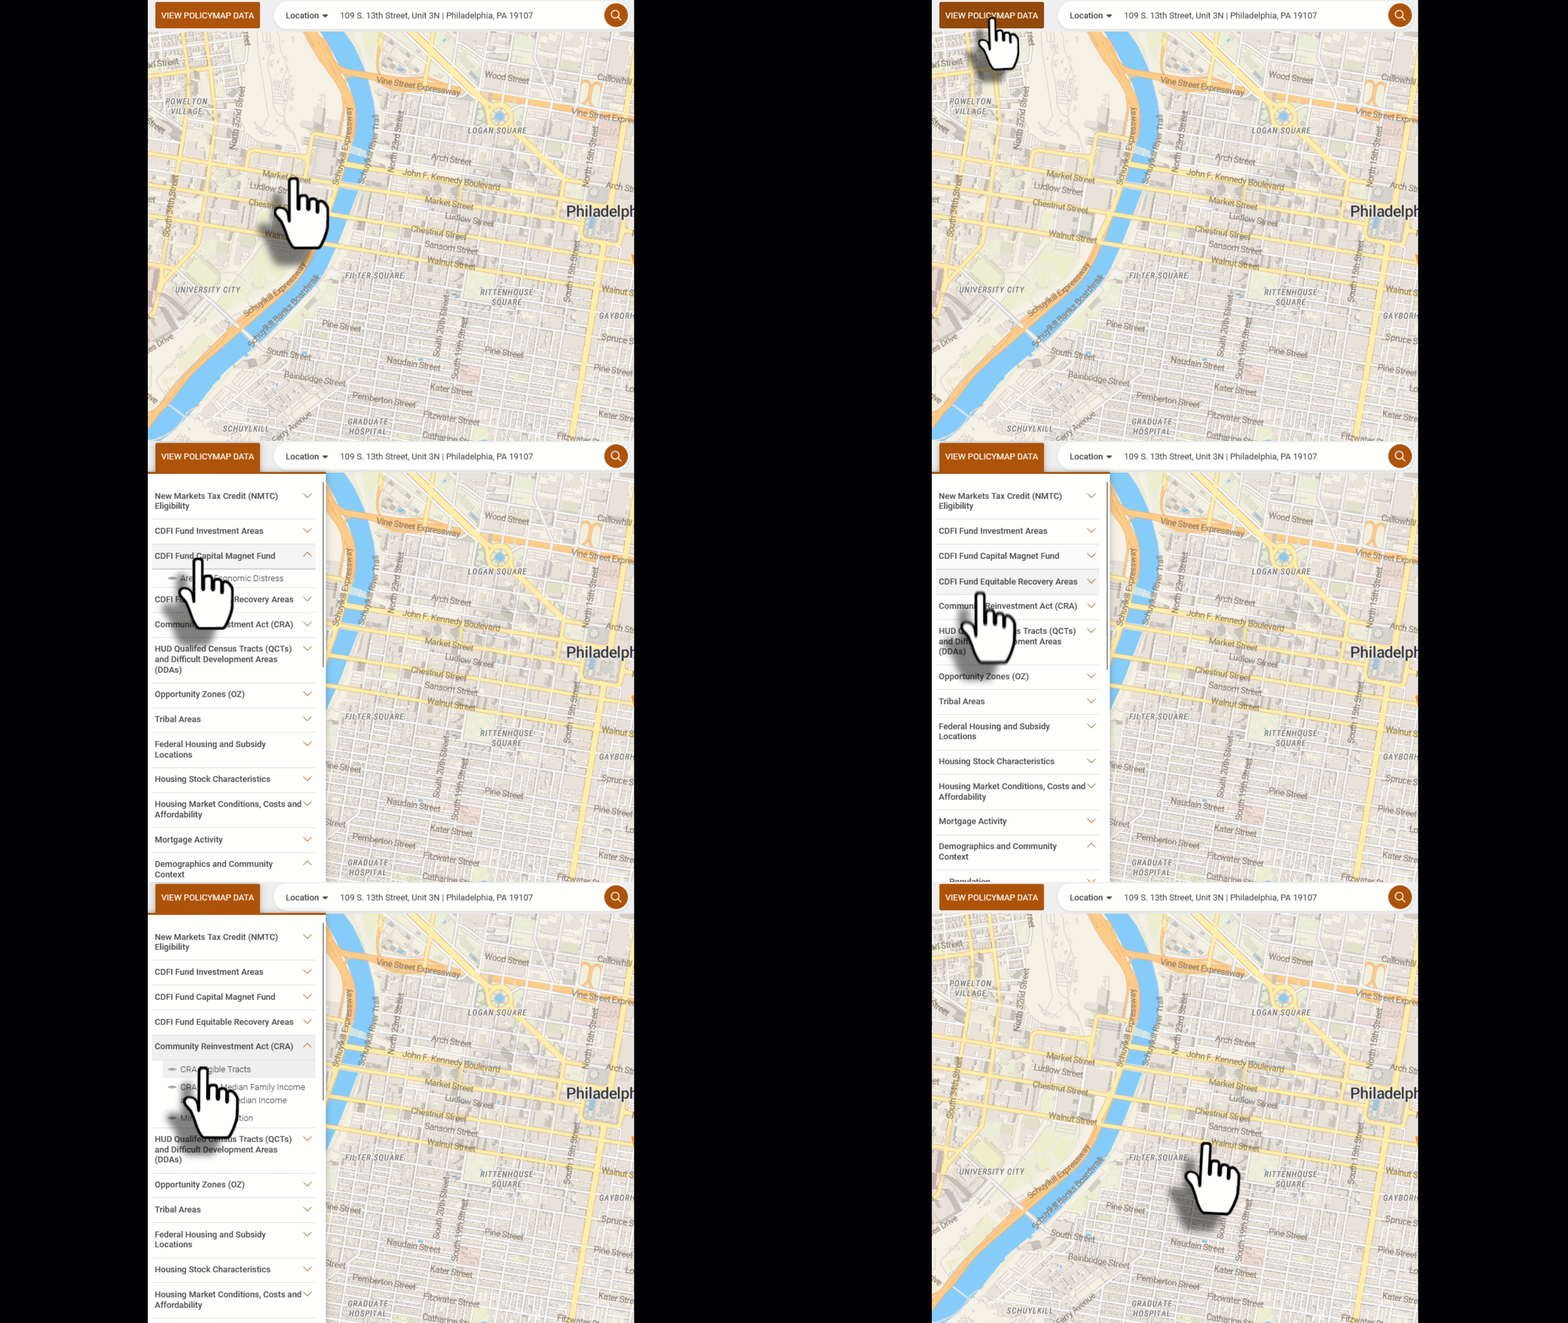
- Use the
 menu to add data on the map. The data listed in the menu depends on the subscribed data package. Click on a submenu (or
  icon) to expand the section and the (
  icon) to collapse a section.
- Data Layers are data aggregated by geography (e.g., county, ZIP code, census tract, etc.).
- Point datasets are address-level data that show addresses as icons on the map.
- Boundaries will display the boundaries for the selected geography.
- Use the legend to customize any data added to the map. Each data type has different customization options. Use the icon to expand the legend and find unique customizations.
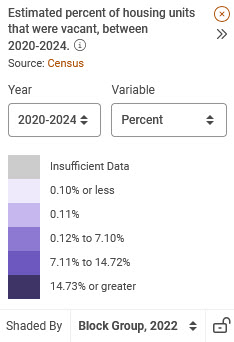 | The Layer legend will display information about the data layer, including year, variable, geography type, and the value range for each color on the map. The legend lets you customize the data on the map by adjusting many of these aspects.
Please note that the year in Shaded By is not the data year but the year the geography was released. |
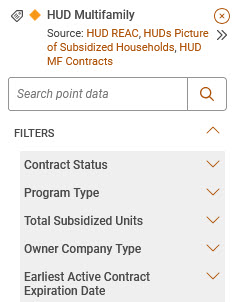 | The Points Legend allows you to view point datasets, like addresses, on a map. You can view these datasets on their own or on top of a data layer.
Use a keyword as a filter. For example, type in "Philadelphia" and only points containing the word "Philadelphia" will appear. |
 | Boundaries will simply show the borders for the selected boundary dataset. Use the The year listed next to the boundary is the year the boundary was published. This is also called the vintage. |
 to lock the geography as you navigate around the map.
 and collapse
  icons to show the full list of filter options.
 icon to turn the labels for each address on or off.
 icon to turn the labels on and off for the area of a boundary.
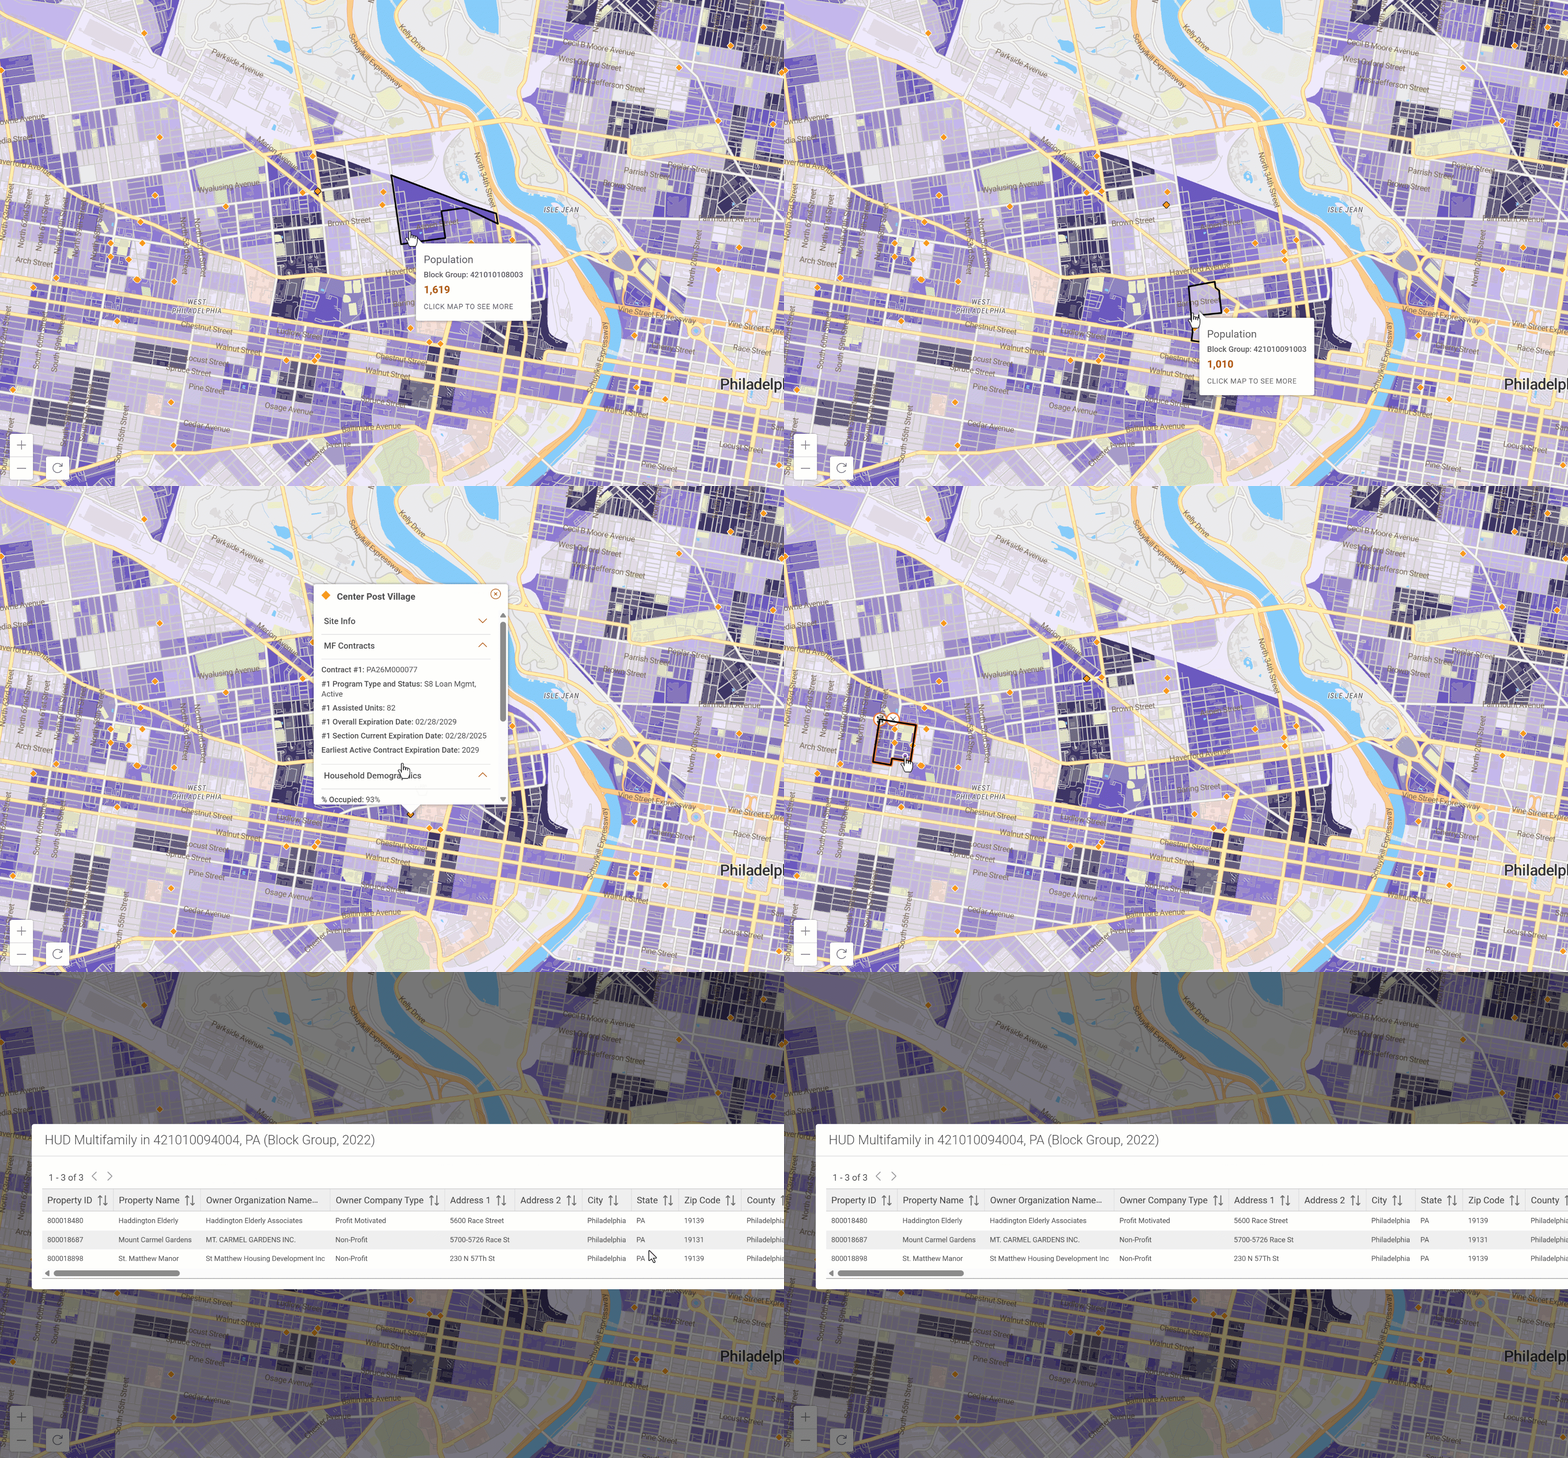
- When a data layer and/or point data is loaded on the map, hover over the geography to see the values for the data layer, and select a point to see the details for each address.
- To see the addresses within a geography as a list, select the geography, select
 , then select the point dataset to display.
Salesforce Record Data
- Use the Salesforce Record Data section to display addresses from records in your Salesforce. Multiple record datasets can be displayed on the map simultaneously.
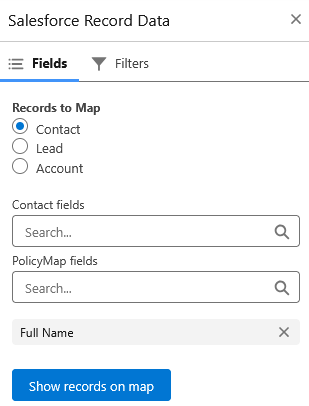
- Fields: Once a Records to Map is selected, use the field menus to select what data to display for each address on the map. If a child record is selected, the parent record will be displayed in the fields section.
- Standard and Custom Object fields will display data from Salesforce for each record.
- PolicyMap fields will display a list of PolicyMap data alongside the address.
- As fields are selected, each label will appear in the list below. Use the X to remove any fields. Select the
 button to display the addresses on the map. Users can continue using the field menus to add other data to the addresses on the map, then select the button again to update the data on the map.
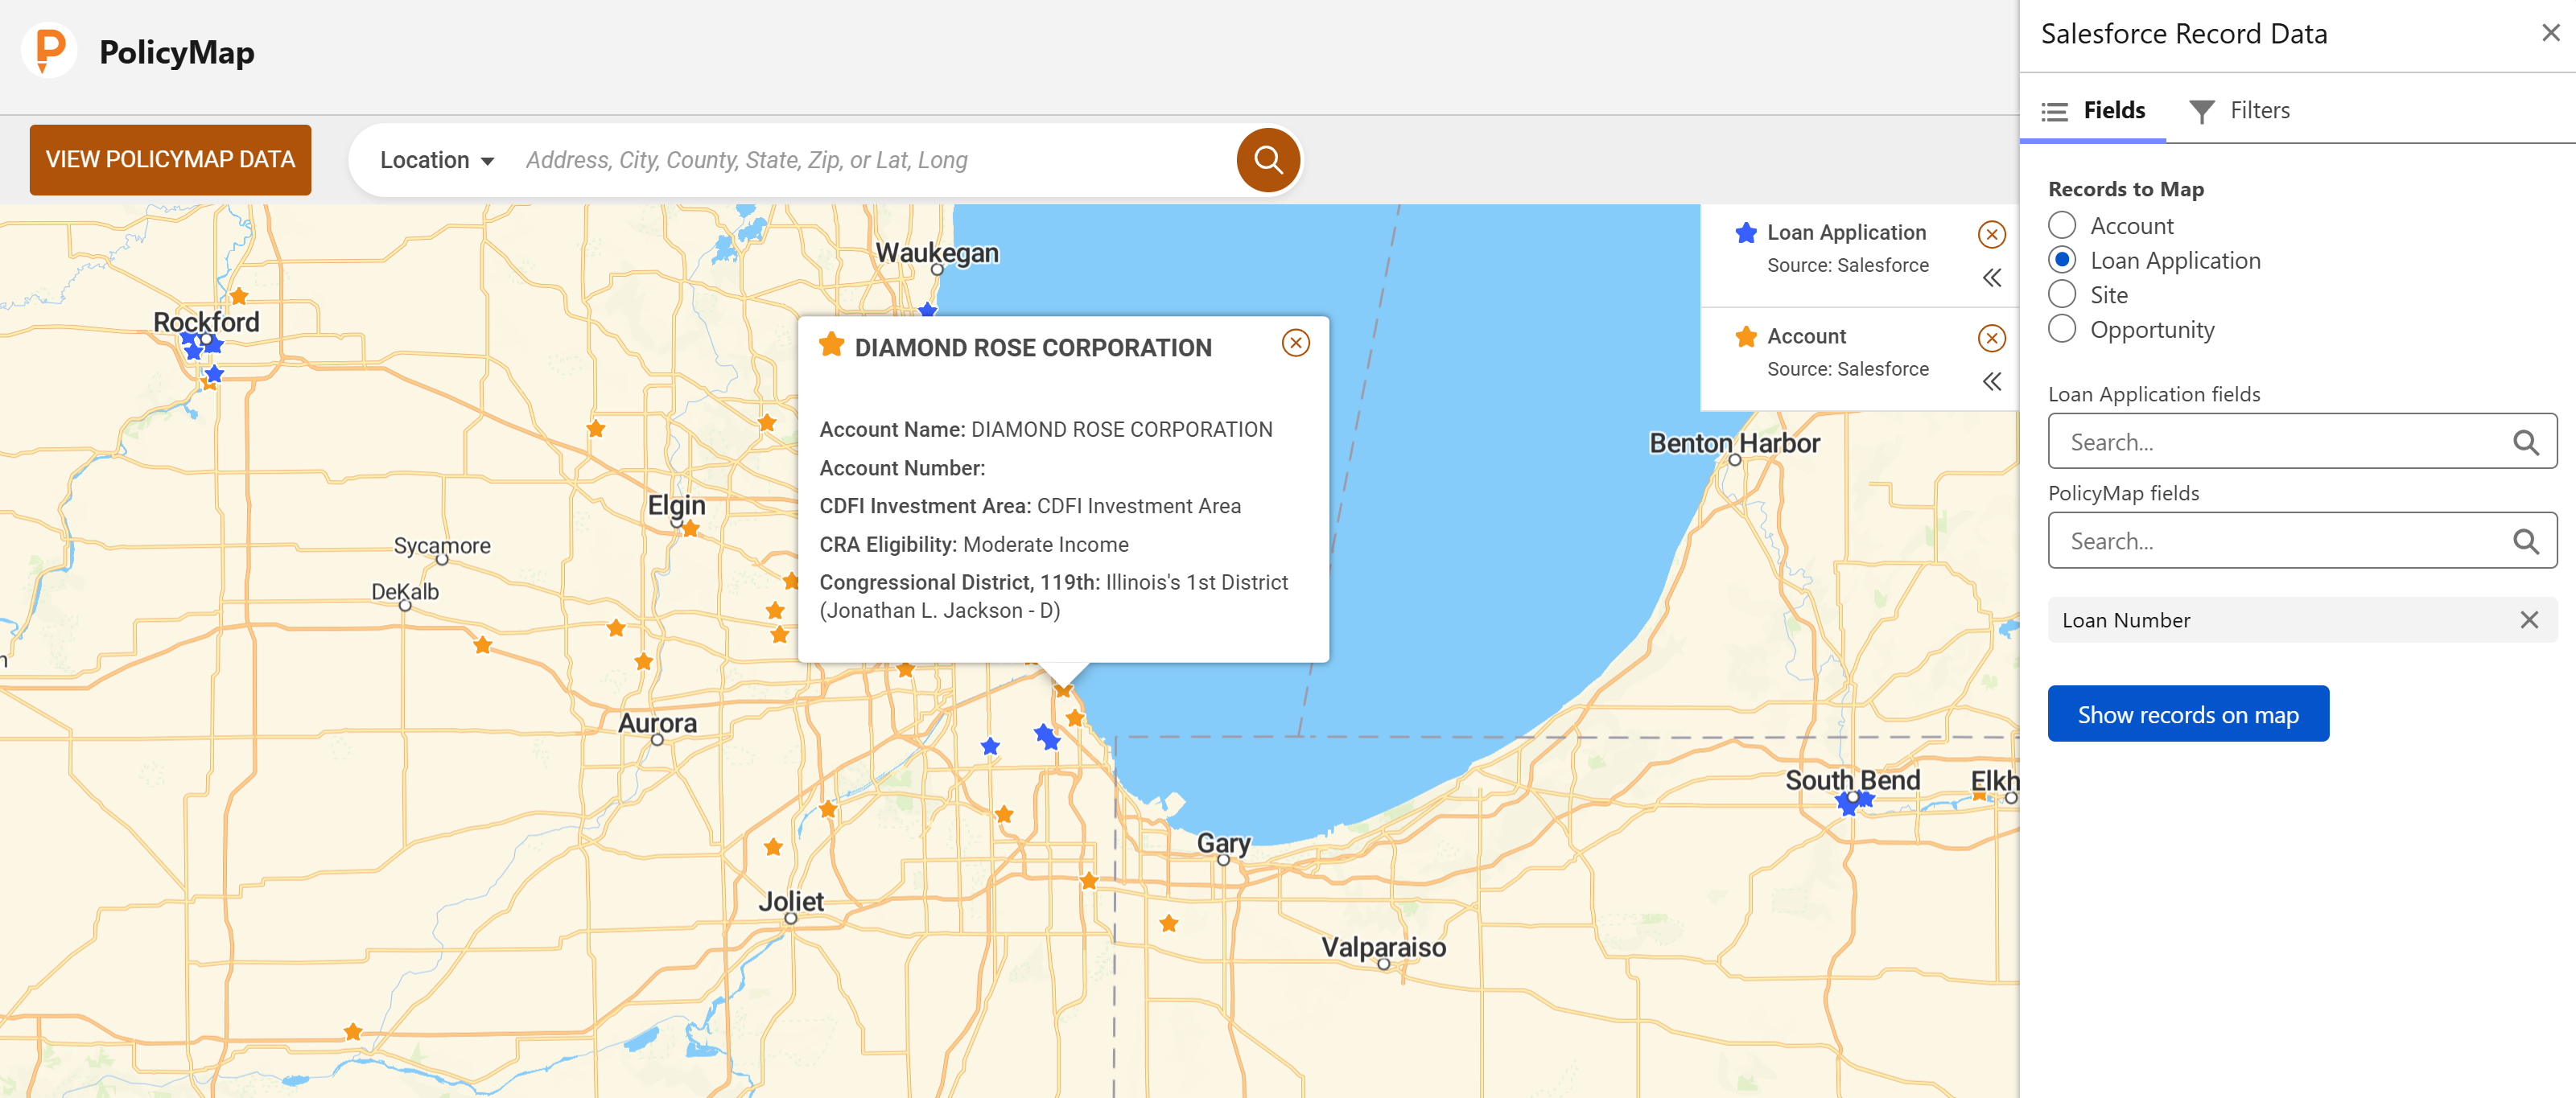
- Filters: Use the filters feature to filter the addresses on the map. Similar to Fields;
- Standard and Custom Object fields will display data from Salesforce for each record.
- PolicyMap fields will display a list of PolicyMap data alongside the address.
- Select Show Records on Map to update the data.
