New and Updated Data (2023)
![]() Updated
by
PolicyMap
Updated
by
PolicyMap
Select the  icon on the top of the helpbot to see the complete list of new and updated data.
Date | Type | Details | Category |
06/20/2024 | New Data | Limited Supermarket Access areas overlay. This new data layer will give users the ability to use alongside other data layers. | Quality of Life > Food Access and Local Foods > Reinvestment Fund LSA Health > Food Access > Supermarket Access |
06/20/2024 | Updated Data | Coal Closure Energy Communities and MSA/Non-MSA Energy Communities are now updated to data as of 2024. This data is from the US Department of Energy, National Energy Technology Lab. | Curated Collections > Clean Energy Tax Incentives > Energy Communities |
12/21/2023 | Updated Data | Home Mortgage Disclosure Act (HMDA) data on residential housing lending has been updated in PolicyMap for the year 2022. HMDA requires mortgage lenders to report on the size, value, and type of home mortgages issued, as well as data on the demographic characteristics of loan recipients. PolicyMap processes the reported data into a variety of indicators relevant to policymakers and communities, such as the count of originations by different housing types, the median value of high-cost loans, and the percent of home loans denials by race and ethnicity, among many others.
Important information on data sources, calculations, and limitations can be found in the Data Dictionary. | Lending > Mortgage Loans |
12/07/2023 | Updated Data | We have updated Medical Expenditure Estimates on PolicyMap to 2020, the most recent year available. These estimates are generated by data on payments for medical care from the Department of Health and Human Services’ Agency for Healthcare Research and Quality (AHRQ) Medical Expenditure Panel Survey with demographic and health data from the U.S. Census American Community Survey (2017-2021). We present estimates on average out-of-pocket spending as well as total aggregate expenditures in a variety of categories:
| Income & Spending > Medical Spending Estimates |
11/21/2023 | Updated Data | Congressional Boundaries update. House: Utah's 2nd district, previously held by Chris Stewart (R), is now vacant. Senate: Dianne Feinstein (CA-D) has been replaced by the soon-to-be-replaced Laphonza R. Butler (CA-D). Fun fact: Californians will be voting 4 times for this seat in 2024. | Boundaries Menu |
11/13/2023 | Updated Data | Limited Supermarket Access areas from the 2023 Reinvestment Fund Limited Supermarket Access Analysis have been added to PolicyMap. See the Data Dictionary entry for more information about the LSA designations and how these indicators were developed. The data covers three time periods – 2013, 2017 and 2022. This data is available in PolicyMap to all users. As a reminder, this does replace the former LSA and Rural LSA data that was previously in PolicyMap. As part of the LSA update, we have also updated Grocery Retail Locations, based on data from NielsenIQ TDLinx, to data as of 2022. The following types of stores are included in the current Grocery Retail Locations data - supermarkets, supercenters, limited assortment stores, natural food stores and grocery warehouses. Notably locations of other store types like Superettes, Dollar Stores, and Food Commissaries are no longer included in the data. Due to restrictions from NielsenIQ, we have had to further strip down the attributes for these stores to just showing a Reinvestment Fund defined store service level - Full Service or Non-Full Service. Full Service grocery stores include Supercenters and Conventional Supermarkets. Non-Full Service grocery stores include Limited Assortment Supermarkets, Natural/Gourmet Food Stores and Grocery Warehouses. This data is only available to subscribers. | Quality of Life > Food Access and Local Foods > Food Access > Reinvestment Fund Limited Supermarket Access (LSA) Qulaity of Life > Quality of Life Locations > Food and Grocery Retail Access |
11/10/2023 | Updated Data | The IMLS Libraries point layer has been updated with the most recent 2021 data. Please note that this update contains 2020-2021 data, thus the annual weeks open field is likely less than typical due to COVID closures. There are also some new indicators added to the info bubble, including data around library programming and ratio of Wi-Fi sessions to visits. | Quality of Life > Institutions Education > Education Locations > Educational Institutions |
11/10/2023 | Updated Data | Black Knight Home Sale Quarterly data for 2023 Q3. This dataset shows the latest trends in the housing market, including median sale prices, the number of sales, and the % change in housing prices by zip codes. | Housing > Home Sales |
11/08/2023 | Updated Data | NMTC Eligibility status by tract has now been updated on PolicyMap to reflect 2016-2020 ACS data. The NMTC status comes with other tract-level status indicators such as Severe Distress, OMB non-metropolitan status, and poverty and unemployment indicators. | Federal Guidelines > CDFI Fund New Market Tax Credit Eligibility |
11/08/2023 | Updated Data | The BLS LAU monthly data has been updated on PolicyMap to include the month of September 2023 | Economy > Employment and Unemployment > Employment |
10/23/2023 | New Data | The CDC Natality data has been updated and expanded to include new indicators. The update contains 2021 and 2022 data (as well as backfilling the new indicators from 2016-2022). The added indicators are delivery method, prenatal visits, and maternal health conditions (eclampsia, gestational diabetes, pre-pregnancy diabetes, gestational hypertension, and pre-pregnancy hypertension). County-level data is very sparse due to a lack of county reporting and CDC suppressing any county with populations less than 100,000. | Health > Vital Statistics > Birth and Prenatal Care |
10/18/2023 | Update Data | The Health Professional Shortage Area (HPSA) data from HRSA has been updated as of 2023. Maternity Care Health Professional Target Area (MCTA) data from HRSA has been included as well. | Health > Access to Medical Care |
10/13/2023 | Update Data | Indicators on tract level CRA Eligibility and Tract Median Family Income % from the FFIEC have been updated in PolicyMap, now current as of 2023. These are some of our most heavily used indicators particularly by banking and financial institution subscribers. Just as a reminder for folks unfamiliar with “CRA” it stands for Community Reinvestment Act (CRA), which was enacted by Congress in 1977 and is intended to encourage depository institutions to help meet the credit needs of the communities in which they operate, including low- and moderate-income neighborhoods. Banks are rated based on their CRA performance and this is taken into account by regulators when considering potential bank acquisitions and mergers. The CRA program has been successful in encouraging banks to provide loans for affordable housing, small business and small farm loans in low and moderate income communities. | Lending > CRA, CDFI, NMTC Programs > CRA Eligibility Federal Guidelines > Additional Federal Guidelines > CRA Eligibility |
10/05/2023 | Update Data | BLS LAU monthly data has been updated on PolicyMap to include the month of August 2023. | Economy > Employment and Unemployment |
09/22/2023 | New Data | We now have a new source for Retail-based Healthcare(e.g., Minute Clinics) on PolicyMap from Data Axle. | Health > Health Facility Locations > Retail-based Healthcare |
09/15/2023 | New Data | The new CDC PLACES data is up on PolicyMap. It includes new indicators on people living with disabilities: six disability types (hearing, vision, cognition, mobility, self-care, and independent living) and any disability. | Curated Collection > Social Determinants of Health |
09/15/2023 | New Data | We recently added a handful of indicators to our Census ACS data as part of specific client deliverables and a few have also been added in PolicyMap proper because they may be of general interest to our users. They are summarized below. Disconnected Youth This is a general term used to refer to young people (between the ages of 16 and 19) who are neither enrolled in school nor working. We’ve added indicators for all 16-19 year olds and then also by sex. These are available in the Education menu under School Enrollment. Measures and indicators related to Disconnected Youth have been used by other organizations like County Health Rankings and Measure of America of the Social Science Research Council. According to County Health Rankings, “several studies have shown that disconnected youth have a disproportionate share of related health problems including chronic unemployment, poverty, mental health disorders, criminal behaviors, incarceration, poor health, and early mortality.” Population Age 3-4 Living in Households The population of 3-4 year olds living in households has been added under Demographics > Age > Age 0-4. This indicator may be of particular interest to subscribers doing work related to early childhood education. | Education > School Enrollment Demographics > Age > Age 0-4 |
09/08/2023 | Update Data | The BLS LAU monthly data has been updated on PolicyMap to include the month of July 2023. | Economy > Employment and Unemployment |
09/08/2023 | Update Data | Updated SNAP Retailer Locations are now updated on PolicyMap for 2023. | Health > Food Access > WIC and SNAP |
09/08/2023 | New Data | New pharmacy location data is up on PolicyMap. It is in a new "Pharmacies" submenu, alongside the existing "Rate of Pharmacies per 100,000 people" indicator. For any individual location, you can see name and address info, as well as a parent brand (such as CVS or Walgreens). | Health > Health Facility Locations |
08/28/2023 | Update Data | The CDC Social Vulnerability Index (SVI) data has been updated on PolicyMap for 2020. This dataset has information on areas where residents will be in greatest need of support and assistance after a disaster or extreme weather event takes place. The dataset includes a categorical ranking of social vulnerability (very low, low, moderate, high) as well as a raw score for both Census Tracts and Counties. | Quality of Life > Environment and Disaster Risk |
08/28/2023 | Update Data | Data from the Health Resources and Services Administration (HRSA) on Medically Underserved Areas (MUA) is now updated on PolicyMap for 2023. This dataset includes information on all census tracts designated as medically underserved areas & populations, as well as an index of medically underservice. | Federal Guidelines > CDFI Fund New Markets Tax Credits Health > COVID-19 |
08/18/2023 | Update Data | Black Knight Home Sale Quarterly data has been updated for 2022 Q4, 2023 Q1, and 2023 Q2. Black Knight Home Sale Annual data has been updated for 2022. It shows the median sale price, number of sales, and % change in housing prices by zip code. | Housing > Home Sales |
08/15/2023 | Updated Data | FEMA flood maps for 2023 have been updated in production. FEMA produces these maps so communities can identify areas that are most at risk of flooding. We show four levels of flood risk, where "high risk", for example, indicates an area that has a 1% annual chance of flooding in a year and a 26% chance of flooding over the life of a 30‐year mortgage. You can see one of these zones around the Winooski River in Burlington VT, which experienced significant flooding earlier in the summer: 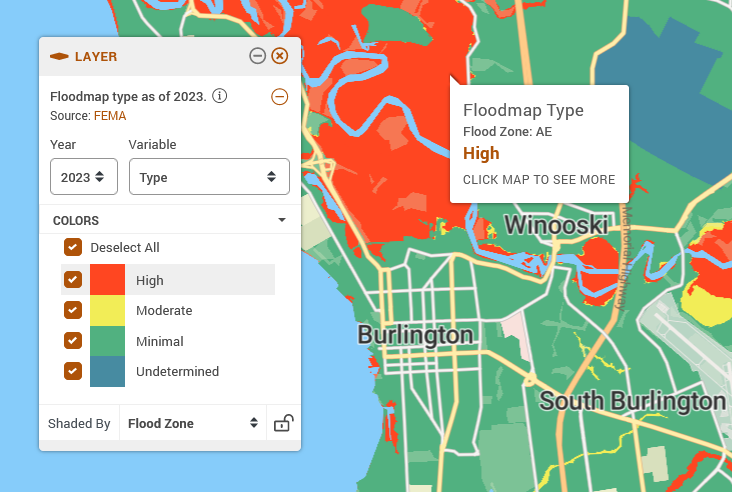 | Housing > Flood Risk Quality of Life > Environment and Disaster Risk > Flood Risk |
08/03/2023 | Updated Data | The Map the Meal Gap data from Feeding America is now updated to 2021. This data addresses food insecurity among adults and children, as well as the annual food budget shortfall and average meal costs. | Incomes & Spending > Food and Nutrition > Food Insecurity |
07/14/2023 | Updated Data | Data from the US Dept. of Agriculture on Farmers' Markets has been updated in PolicyMap. This data includes all listed Farmers' Markets locations, and the number of Farmers' Markets per 100k population. The data is updated to use the 2022 USDA data, and now uses 2020 county boundaries, and the most recent ACS population data. | Quality of Life > Quality of Life Locations |
07/14/2023 | Updated Data | Data from HUD on the locations of Low-Income Housing Tax Credit (LIHTC) projects has been updated in PolicyMap. This update includes projects with allocation years through 2021. | Housing > Housing Locations Federal Guidelines > Federal Housing and Subsidiaries Locations |
06/28/2023 | Updated Data | The National Dataset for Hospitals and Nursing Facilities point datasets have been updated for the year 2023. The Nursing Facilities dataset includes additional information such as: Total beds, Rural Status, Phone number, Whether it is hospital-based, and Medicare and Medicaid Designation The Hospital facilities' dataset includes additional information such as Facility sub type = short-term, critical access etc., Total beds, Certified bed, Full-Time physicians, Nurses, Full-Time personnel. Med school affiliation, Phone number, Rural Status | Health > Health Facilities Locations |
06/20/2023 | New Data | New data from Candid on the locations of nonprofit organizations have been added to PolicyMap. This point-level data is available to subscribers only under Quality of Life > Quality of Life Locations > Institutions. Points can be filtered based on NTEE Group, Type of Return Filed, and certain financial reporting attributes. Please note, now that the Candid data is live, the former Nonprofit Locations data from NCCS/Urban Institute has been removed from PolicyMap Proper. | Quality of Life > Quality of Life Locations |
06/16/2023 | Updated Data | The University of South Carolina's Hazards Vulnerability Research Institute's Baseline Resilience Indicators for Communities (BRIC) has been updated to the latest release, for 2020. BRIC indicators measure resilience to a variety of challenges at the county level, currently measured for 6 categories:
The six components are added together to create a county's overall "BRIC" score. We also calculate the percent change in resilience over the previous five-year periods, which enables users to make inferences about where resilience is changing the most: for example, Lee County FL, where Hurricane Ian made landfall in 2022, has had -23% change in environmental resiliency since 2015. | Quality of Life > Environment and Disaster Risk > Resilience |
06/15/2023 | Updated Data | The US Dept. of Energy NETL Energy Communities data has been updated to reflect the latest available data from the source on Energy Communities. The key update is that official MSA/Non-MSA Energy Community designations for 2023 have been released. The initial release of this indicator just identified MSAs or Non-MSAs that met the Fossil Fuel Employment (FFE) threshold but the unemployment rate requirement had not yet been determined so official Energy Community status for these areas was unknown. This latest data now shows MSAs/Non-MSAs that meet both the FFE threshold and the unemployment rate requirement (an unemployment rate in 2022 equal to or greater than the national average) – and therefore these areas are designated as Energy Communities for IRA tax credit bonuses. | Clean Energy Tax Incentives Curated Collection under Energy Communities > MSA/Non-MSA Energy Communities |
05/19/2023 | Updated Data | Congress Update Virginia's 4th district, previously vacant, is now held by Jennifer L. McClellan - D. Nebraska's senate seat, previously vacant, is now held by Pete Ricketts - R. | Boundaries Menu |
05/11/2023 | Updated Data | Sunsetting Analytics Menu We have sunset the Analytics menu in PolicyMap but most of the datasets and indicators formerly available there can be found under other PolicyMap data menus – below is a summary.
The Opportunity Zones Social Needs Index data has been retired from the platform. | Multiple |
04/27/2023 | Updated Data | CDFI eligibility was updated to include 2016-2020 ACS data. Many of the eligibility criteria are listed as with a time frame of 2023 since that is when the CDFI published the criteria; however, the description notes which ACS underlying data is being used in the calculations. Please note that according to the CDFI fund program both the 2011-2015 and 2016-2020 ACS data are currently eligibility during the one-year transition period. For more information see https://www.cdfifund.gov/news/468#_ftn1 | Federal Guidelines > Additional CDFI Fund Programs > Investment Areas |
04/25/2023 | Updated Data | The CDC publishes detailed estimates of the incidence and number of cancer cases. The include statistics on cancer cases by type (i.e., organs affected), with breakdowns by race/ethnicity and gender for most counties in the United States. An example would be: "The rate (per 100k) of lung cancer cases among white people in Philadelphia County from 2015-2019". | Health > Health Conditions |
04/25/2023 | Updated Data | The Department of Housing and Urban Development regularly publishes Small Area Fair Market Rents, which are used to set rates for vouchers for small areas than traditional FMRs: zip, rather than metro area. They are presented as dollar amounts for particular sized units for the upcoming year, e.g., the fair market rent for a 4 bedroom in zip 19107 is $3,060 for 2023. | Housing > Rents and Rental Units |
03/14/2023 | Updated Data | BLS Local Area Unemployment data for the months of August-December 2022 is available on PolicyMap. The LAU program estimates monthly and annual employment and unemployment rates and counts for a wide variety of geographic areas. | Economy > Employment and Unemployment |
03/14/2023 | Updated Data | The Census LEHD – Longitudinal Employer-Household Dynamics (LEHD) Origin-Destination Employment Statistics (LODES) data has been updated to 2019. These variables show employment data by worker residence and employer location. Data is available for employee demographics, including age, ethnicity/race, sex, education, and earnings. Data is also available for worker industry and firm age and size. Note that information about federal employees is available starting in 2010 onwards. | Economy > Small Business and Startups Economy > Workforce Characteristics |
03/08/2023 | Updated Data | The owner and renter affordability data has been updated to use the latest 2017-2021 data. These variables were calculated by PolicyMap using HUD AMI and Census ACS data. This dataset is considered propriety to PolicyMap. These estimate provide information on the relative affordability of rental and owner-occupied housing in different areas of the country and highlight needs or shortcomings in the locally available housing stock compared with local median incomes. | Housing > Affordability and Cost Burdens > Affordability |
02/28/2023 | Updated Data | Lead Risk data has been updated on PolicyMap. The methodology was developed by researchers at the University of Washington and extended with Vox Media. We present a raw score of lead risk that is derived as a combination of the age of housing in a particular census tract, as well as the relative level of poverty in that location. This is based on the UW researchers who found these factors most associated with lead risk. A "high" risk indicates that a given census tract has a higher-than-average concentration of older homes, a higher-than average poverty rate, or both. The estimates themselves are derived from ACS data, and presented as a raw score, a ranking on a 1-10 scale with 10 being the highest risk, and a categorical ranking ("Very Low" to "High"). The data can be used to visualize where there might be risk in lead exposure in communities; in the case of lead, prevention is critically important. The data is available to all users, and not available for download. | Health > Risk Factors > Lead Risk |
02/22/2023 | Updated Data | The diversity index and predominant race data have been updated to use the latest 2017-2021 ACS data. These variables were calculated from Census ACS race data. Predominant race is available with and without Hispanic ethnicity and with and without predominant groups that are less than 50% of the total population. Diversity index shows the probability that two individuals chosen at random would be of different races or ethnicities - lower index values between 0 and 20 suggest more homogeneity and higher index values above 50 suggest more heterogeneity. | Demographics > Race, Ethnicity, Diversity > Diversity |
02/07/2023 | Updated Data | IRS Migration data has been updated on PolicyMap. | Demographics > Migration > Annual Migration |
01/31/2023 | Updated Data | CDC PLACES data has been updated. PLACES data provides estimates of different disease burdens at the County, tract, and zip level across the country. Note that PLACES is a bit different with the way it handles time: the survey the data is based on doesn't ask about every condition in every year, so some conditions (such as arthritis) are available for 2020, while others (high blood pressure) are available at 2019. This is a feature inherent to the data provided by CDC. | Health > Health Conditions > Chronic Conditions |
01/20/2023 | Updated Data | historic time periods available are now 2007-2011 and 2012-2016, in addition to the decennial 2000, 2010 and 2020 years. This data is available to all users and can be found in almost every menu on Policymap. All related reports were also updated | All |
01/06/2023 | New Data | Average Neighborhood Poverty Rate by Federally Subsidized Housing Type has been added. This is available to all users, but cannot be downloaded. High average neighborhood poverty rates for federally subsidized housing can indicate that units are unevenly distributed within a jurisdiction or concentrated in neighborhoods with limited educational and economic mobility opportunities | Income & Spending > Poverty |
01/05/2023 | Updated Data | High school graduation rate data, sourced from the National Center for Education Statistics (NCES) at the United States Department of Education, is now available on PolicyMap for the years 2017-2019. The school district level data as “adjusted four-year cohort graduation rate” is available to all users. | Education > School District Statistics > Graduation Rate |