Making a Map
![]() Updated
by
PolicyMap
Updated
by
PolicyMap
Search the Map
To start, you should specify a location. The location box above the maps allows you to quickly find and position the map to different places.
- By Location – The default search is by Location, so enter an address, city, state, zip code, etc in the entry box and hit Enter/Return on your keyboard or click the magnifying glass icon.
- If searching by a type of geography, like Philadelphia, you will see the map position itself at the location you entered, with a border surrounding the geography. If more than one location in the US has the same name, the map will default to the largest populated location, and a box will appear listing all matching locations by population.
- If you are searching by an address, the map will zoom to the address and drop a pin.
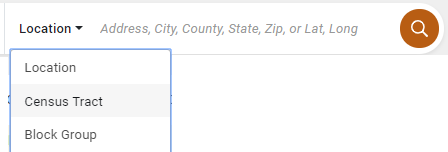
- By Pre-Defined Geography – Use the drop down menu in the Location bar to search for specific geographies. For example, if you want to find a specific census tract, start by selecting Census Tract from the drop-down menu. Simply enter the FIPS code for the tract and hit Enter/Return on your keyboard or click the magnifying glass icon.
Viewing the map – You can zoom in and out by double-clicking the map, using the scroll wheel on your mouse, or using the +/- buttons in the bottom right of the map. To pan the map, select and hold your left mouse button then drag the map within the map window.
Adding Data from Search
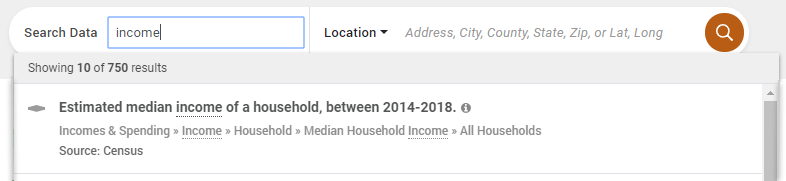
The Search Data field allows user to use keywords or a grouping of words to find the data that is available on PolicyMap.
- The top of the results bar will show the total number of matches for the keyword. If the results do not match the data you are looking for, try to add additional words or specific keywords.
- The results will show the data title, where to find the data in the category, and the source of the data. Mouse over the icon to see the data description.
Adding Data from Categories
Select a category and navigate the menu to the indicator to add the map.
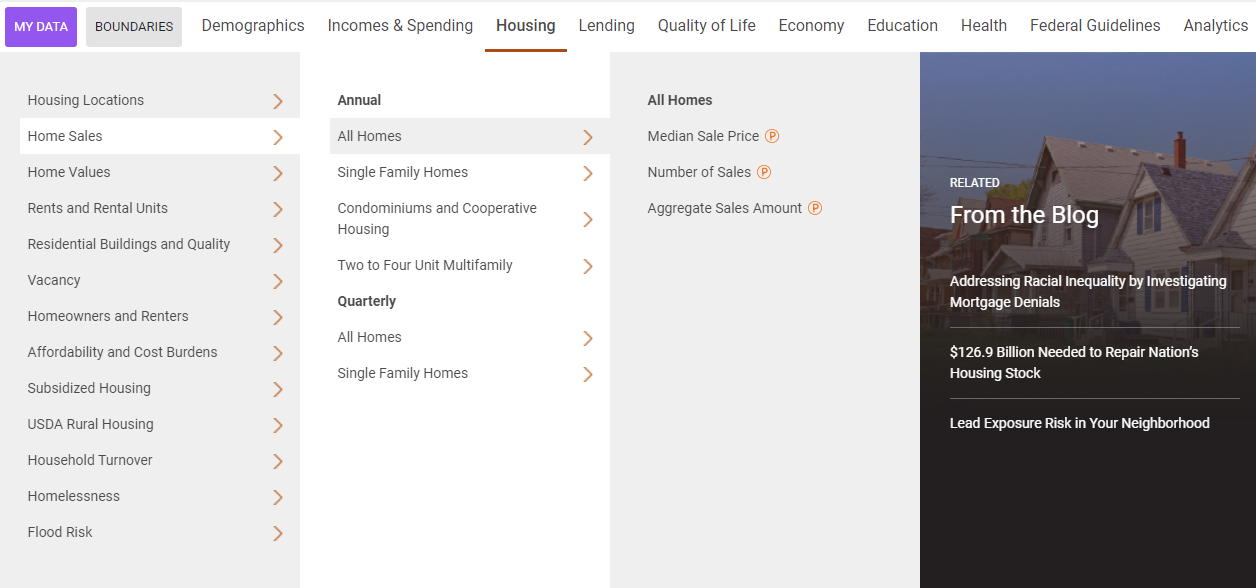
- The first sub-menu group will be the group of point/address level datasets, if there is point data for the category. Point/Address level data will also show an icon next to the name.

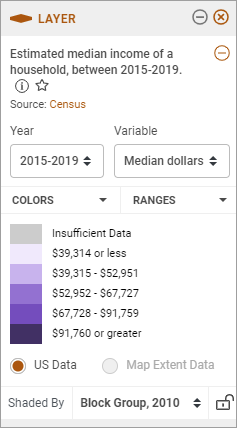
Data Layer Customization
The Data Layer legend will display the data title, Year, Variable, Range Values, etc and the values for each color range on the map. Use the data layer legend to customize the map by changing the year, the variable, or aggregation.
 |
|
 to see a full description of the data layer.
 icon to prevent Shade By from changing as you zoom in and out of the map.
Select the color range in the legend to isolate a range or multiple ranges on the map.
Data Points Customization
Data Points allows you to view point datasets, like addresses, on a map. You can view these datasets by themselves or on top of a data layer.
When you load a point dataset, the Data Points legend will appear. The legend will display what icon the dataset is represented on the map, the optional ability to search, and the filter points. Click on any icon to display information about that site in the info bubble.
- Customize the color, shape, and size of any point dataset.
- Filter datasets: To filter, select the filter points button . The map will refresh and a subset of the dataset will now appear on the map. You can apply multiple filters to any dataset.
- Multiple filters can be applied at the same time, simply keep adding the filters.
- Some filters have unique color coding options,
- Add multiple point datasets to you map: Simply click on each one you wish to add from the menu.
- You can remove any site dataset or a filter(s) by clicking the X symbol next to the name.
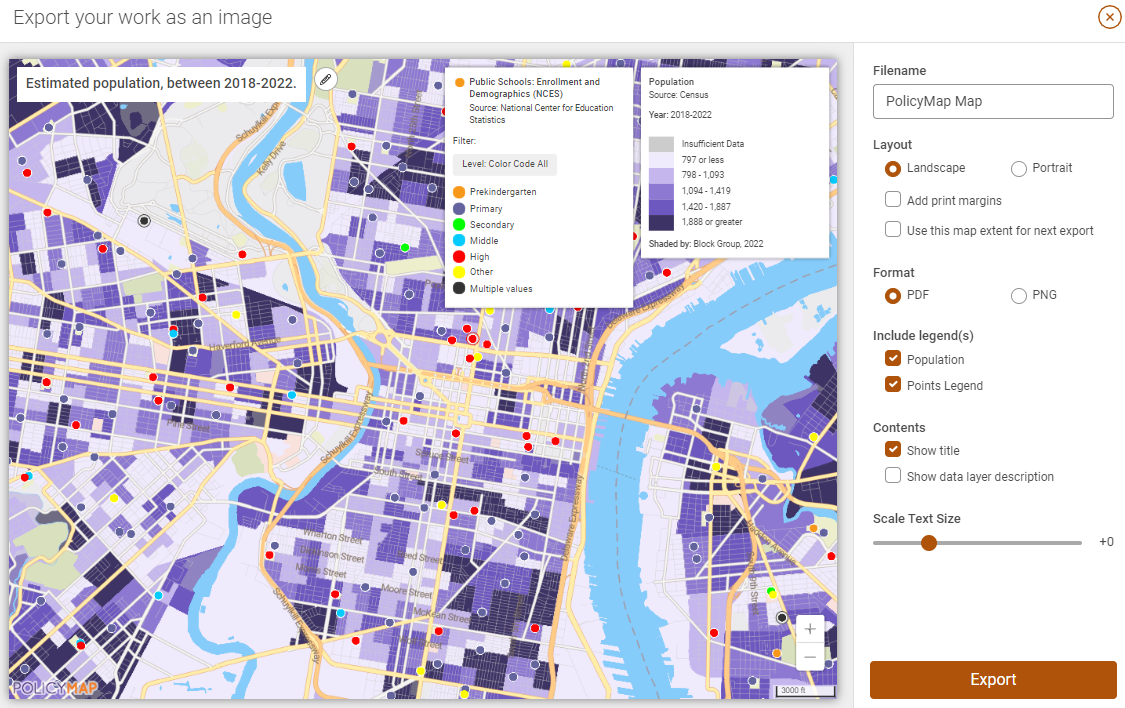
Print/Export the Map
Select the print icon on the bottom right to open the print modal.  The modal allows users to pan and zoom within the window. Users can make additional customizations including;
- Changing the map title
- Orientation of the map from landscape or portrait
- Add margins
- Type of file to export as either a PDF or PNG
- Add and remove information on the map