New and Updated Data (2025)
![]() Updated
by
PolicyMap
Updated
by
PolicyMap
Date | Type | Details | Category |
12/22/2025 | Updated Data | Federal Tax Return data from the IRS has been updated to 2022. This update includes changes to indicators relating to income from IRAs, pensions, and annuities. Previously, these income sources were displayed as a single indicator on PolicyMap which was discovered to be using data for just pensions and annuities. To correct this, the indicator has been split into two: one for IRA distributions and one for income from pensions and annuities. Data for 2018 is missing because the IRS combined IRA distributions with pensions and annuities into a single field that year, making it impossible to distinguish between the two. In 2019, IRA distributions were again reported separately from pensions or annuities. This has been noted in the descriptions for the indicators. Please feel free to reach out with any questions. | Incomes & Spending > Federal Tax Returns |
12/19/2025 | Updated Data | The CDC Opioid Prescription data has been updated through 2023. | Health > Risk Factors > Opioid Use > Prescription Rate |
12/17/2025 | Updated Data | CDC Cancer Incidence data has been updated for the latest 2018-2022 time period. | Health > Health Conditions > Cancer |
12/02/2025 | Updated Data | HUD Racially or Ethnically Concentrated Areas of Poverty (RECAPs) data is now available on production. This data previously only existed in our reports, but it is now also live on production for the latest data year 2020. For a census tract to be designated as RECAPs they must have:
| Federal Guidelines > Housing and Urban Development |
12/01/2025 | NEW DATA | The Medicare chronic condition prevalence index rating was created by following the CDC's guidelines for creating estimates of high prevalence of multiple chronic diseases. | Health > Health Conditions > Chronic Conditions |
12/01/2025 | NEW DATA | Chronic condition prevalence index. This dataset shows where chronic conditions pose the most burden on an area. A rating of 'highest' indicates that the ZCTA experiences higher prevalences of individual chronic conditions, multiple types of chronic conditions, or a combination of the two. Note this includes a rated index (which shows lowest, moderate, highest) and also raw scores. | Health > Health Conditions > Chronic Conditions |
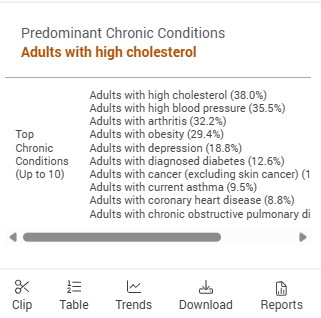
12/01/2025 | NEW DATA | Predominant chronic conditions. Shows which dataset, within a given geography, accounts for the highest percentage of individuals who experience that condition. It also utilizes our new ranked multi-info bubble to show the top 10 chronic conditions: | Health > Health Conditions > Chronic Conditions |
12/01/2025 | NEW DATA | The Agency for Healthcare Research and Quality’s (AHRQ) Compendium of U.S. Health Systems data is now available on PolicyMap. This release includes four new point datasets showing the locations of hospitals, nursing homes, outpatient sites, and home health care organizations that are part of a health system in the United States. Each dataset contains information on both the individual facility and the health system it belongs to. According to AHRQ, “A health system includes at least one hospital and at least one group of physicians that provides comprehensive care (including primary and specialty care) who are connected with each other and with the hospital through common ownership or joint management.” Additionally, a health system must include at least one non-federal acute care hospital, at least 50 physicians, and at least 10 primary care physicians. Organizations in the source data are aggregated to their highest level of ownership, meaning subsidiary systems of larger national systems are not listed separately. As a result, AHRQ notes that not all health systems operating in certain states or local markets may appear in the source. Facilities that had data available but were not able to be connected to a health system, have been excluded from this data. For more information, visit: https://www.ahrq.gov/chsp/data-resources/compendium.html. | Health > Health Facility Locations > Health System Locations |
11/21/2025 | NEW DATA | The U.S. Department of Labor National Database of Childcare Prices is now available on PolicyMap. The U.S. Department of Labor National Database of Childcare Prices (NDCP) data shows the cost of childcare and cost of childcare as a percent of median family income at the county-level by care-type (center or home-based) and age (infant, toddler, preschool, or school-age). Childcare affordability data is also available at the state-level, which shows what level of childcare burden most children are facing. | Incomes & Spending > Affordability |
11/18/2025 | Updated Data | The Adjusted Cohort Graduation Rates Data is now updated through School Year (SY) 2023. This update includes SY 22 and 23. This layer dataset shows the respective graduation rate for various different cohorts (race/ethnicity, disability, limited English proficiency, etc.) at the school district level. It is calculated by taking the number of students who graduate in four years and dividing that number by the number of students who form the adjusted cohort for the graduating class. The 'adjustments' to the cohort are made by adding any students who transfer into the cohort and subtracting any students who exit the cohort (transfer, death etc.) after the beginning of 9th grade. In order to maximize the coverage of this data, we grouped the specific values into broader ranges. We also only show data for districts with total graduating denominators greater than 30 students, and greater than 15 students for the select cohorts. | Education > School District Statistics > Graduation Rate |
11/17/2025 | NEW DATA | New data enhancement layers on predominant housing tenure are now available on PolicyMap. This data uses ACS 5-year estimates to identify whether most occupied housing units in a geography are owner-occupied or renter-occupied. Disaggregations are available by race and ethnicity to explore which tenure type is more common within each group individually. The dataset also includes a change in tenure indicator that compares the predominance across ACS time periods. Percent change values in the bubble only appear when the same tenure type stays predominant across both periods. For the geographies that changed predominance, it will flag when a geography flips from one tenure type to the other, or for the race and ethnicity layers whether a group falls above or below the minimum threshold. A suppression threshold of 50 occupied units is in place to keep the results stable and avoid noise. | Housing > Homeowners and Renters > Predominant Tenure |
11/07/2025 | NEW DATA | We added new data to PolicyMap from BLS that shows industry specialization at the county and state level. This data comes from an already existing dataset: BLS Quarterly Census of Employment and Wages (QCEW), which provides detailed data on employment and wages by industry. Industry specialization is determined by finding the highest "location quotient" (LQ) of an industry. The LQ is a number that tells you how concentrated a particular industry is in a specific area compared to the national average. For example, in Philadelphia County, the LQ for employment for Educational Services in the private sector is roughly 4. Educational Services makes up 8% of jobs in Philadelphia, compared to about 2% nationally. So employment in this sector is about 4 times more concentrated in Philadelphia than in the U.S. overall. If an LQ is equal to 1, then the industry has the same share of its area employment as it does in the nation. An LQ greater than 1 indicates an industry with a greater share of the local area employment than is the case nationwide. The multi-indicator info bubble displays additional indicators like average annual employment, establishments, and wages to offer more context of the economy. There are also hyperlinks available to NAICS websites to learn more about what makes up a particular industry. | Economy > Jobs and Industries > Industry Specialization |
11/05/2025 | Updated Data | Supplemental Nutrition Assistance Program (SNAP) recipient data from the Census Bureau has been updated to 2022 data. | Incomes & Spending > Food and Nutrition > SNAP and WIC > All Recipients |
10/27/2025 | Updated Data | Qualified Census Tracts (QCTs) and Difficult Development Areas (DDAs) from HUD have been updated to 2026 data. | Federal Guidelines > Housing and Urban Development |
10/14/2025 | Updated Data | Fair Market Rent and Small Area Fair Market Rent data from HUD have been updated to 2026. Data for Small Area FMR is much more widely available from 2025 on. HUD has expanded data to non-metropolitan counties in this release. | Housing > Rents and Rental Units > Fair Market Rents |
10/10/2025 | Updated Data | The Black Knight home sales quarterly data has been updated for 2025, Quarter 2. | Housing > Home Sales |
09/30/2025 | Updated Data | HUD's CDBG program activity point dataset has been updated to 2024. | Federal Guidelines > Federal Housing and Subsidy Locations > Housing and Urban Development |
09/24/2025 | Updated Data | Supplemental Security Income data from the Social Security Administration has been updated to 2024. This dataset provides number and percent of SSI recipients by state and county, along with the amount of payments. Please note that this data is monthly and only applies to December of the selected year. It is not annual data. | Demographics > People with Disabilities > Federal Assistance |
09/22/2025 | Updated Data | Medically Underserved Areas (MUA) data from HRSA has been updated to 2025. | Health > Access to Medical Care > Medically Underserved Areas (MUA) |
09/18/2025 | Updated Data | FEMA data as of August 2025. The flood zone layers show what areas have been defined as flood hazard areas on Flood Insurance Rate Maps. For ease of interpretation, PolicyMap has translated the flood zone designations into High, Moderate, Minimal and Undetermined risk of flooding. The granular Flood Zone designations are available in the indicator bubble. | Quality of Life > Environment and Disaster Risk > Disaster Risk > Flood Risk |
09/18/2025 | NEW DATA | Urban Institute Medical Debt Landscape. This dataset provides:
Beginning in 2022, credit reports no longer include paid medical collections, collections less than a year old, or collections under $500. The spike in the median medical debt indicator in 2023 reflects these changes, since only larger debts remain in the data. In addition, as of August 2023, Colorado excludes all medical debt from credit reports | Health > Costs and Insurance > Medical Debt Landscape |
09/18/2025 | Updated Data | U.S. Election Atlas has been updated through 2024. It's a full refresh, as the source has re-released a significant portion of the historical data. Voter turnout has been updated to use this source. It now reflects the voting-age population (VAP), instead of the previous voting-eligible population (VEP) measure. Turnout for Senate elections has also been added. The margin of victory indicators now include vote counts and account for Senate special elections, which are only displayed in a bubble when one has occurred. | Demographics > Elections |
09/15/2025 | Updated Data | Health Professional Shortage Areas (HPSA) data from HRSA has been updated to 2025. | Health > Access to Medical Care > Health Professional Shortage Areas (HPSA) |
09/04/2025 | Updated Data | BLS Quarterly Census of Employment and Wages (QCEW) data has been updated to 2024. | Economy > Jobs and Industries > Jobs and Wages by Industry (County) |
09/04/2025 | Updated Data | FEMA Disaster Declarations and Disaster Assistance has been updated to data as of August 2025. Annual time frames have also been added to Disaster Assistance data.
| Quality of Life > Environment and Disaster Risk > FEMA Disaster Declarations and Assistance |
09/02/2025 | Updated Data | Head Start Center location data from HHS Office of the Administration for Children & Families has been updated to 2025. | Education > Education Locations |
08/27/2025 | Updated Data | The free and reduced-price lunch program (FRPL) eligibility data has been updated through the 2023-2024 School Year. Please note that historic percent data for 2019-2020 was recalculated and reloaded. | Education > School District Statistics > Free and Reduced-Price Lunch Eligibility |
08/25/2025 | Updated Data | The CMS Opioid Claims data has been updated through 2023. It is available to all users and can be found in the Health menu. This update is an entire data refresh for both Medicaid and Medicare. The release includes newly available zip- and county-level data for Medicaid prescription claims, which was previously only available at the state-level. However, data for smaller geographies may be sparse as they had to meet CMS quality measures and undergo suppression. Check out the description info bubble for more detail. | Health > Risk Factors > Opioid Use > Claims |
08/21/2025 | Updated Data | Chronic Health Conditions data for Medicare Beneficiaries from CMS has been updated to 2023. | Health > Health Conditions > Chronic Conditions |
08/21/2025 | Updated Data | The National Center for Education Statistics (NCES) Common Core of Data (CCD) dataset has been updated to the 2023-2024 School Year. The points indicate the locations of public schools, and clicking on a school will display demographic and enrollment information in the information bubble. | Education > Education Locations > Public Schools > Public Schools: Enrollment and Demographics (NCES) |
08/15/2025 | Updated Data | Housing Price Index data from the Federal Housing Finance Agency (FHFA) has been updated to 2024 data. | Housing > Home Sales |
08/12/2025 | NEW DATA | Census County Business Patterns Establishments are now available on production. For context, we display the Census County Business Patterns data as the count and percent of jobs broken down by industry classifications. These new indicators pull certain quality of life - related industries and maps the number and rate of establishments per 100,000 people. This dataset complements the existing Jobs by Industry dataset, providing workforce-related data, and offers additional insights into local companies and establishments. The count data is available starting at the zip code level. Due to population estimates, the rates are only available starting at the county-level. | Economy > Job and Industries > Establishments by Industry Quality of Life > Cultural Institutions |
08/11/2025 | Updated Data | Annual Flu data from the CDC has been updated to the 2024-2025 season. | Health > Health Conditions > Infectious Disease |
08/11/2025 | Updated Data | Valassis vacancy data has been updated through 2025 Qtr2. | Housing > Vacancy > Residential and Business (Valassis Lists) conomy > Business Vacancy |
08/11/2025 | Updated Data | HUD CDBG Eligibility data has been updated to 2024. Low and Moderate Income data relating to Eligibility status has also been re-released to reflect the 5-year ACS estimates used in determining eligibility status. With this update, PolicyMap has determined that CDBG LowMod data had only been updated every five years, coinciding with the release of successive ACS 5-year estimates (2010 > 2015 > 2020). To more accurately reflect the time frames used in LowMod calculations, we have changed the LowMod indicators to align with ACS time frames rather than individual years. These LowMod indicators will next be updated with the release of the 2025 ACS estimates, which are expected to be published in 2028. Please note that the CDBG LowMod time frames differ from those found in the Income & Spending menu, which are updated annually. The CDBG LowMod indicators should only be viewed as a reference to determine eligibility status, rather than the most up-to-date information. If you have any questions, please refer to the data directory or HUD Notice CPD-24-04. | Federal Guidelines > Housing and Urban Development > Community Development Block Grant (CDBG) Eligibility |
08/05/2025 | Updated Data | Mortgage Loans and Mortgage Loans Denial data from the Federal Financial Institutions Examination Council (FFIEC) and PolicyMap have been updated to 2024. | Lending > Mortgage Loans Lending > Mortgage Loans Denials |
08/05/2025 | Updated Data | County Business Patterns data from the Census Bureau has been updated to 2023. | Economy > Jobs and Industries > Jobs by Industry (Zip Code) |
08/01/2025 | Updated Data | BLS Local Area Unemployment (LAU) monthly statistics data has been updated through June 2025. | Economy > Employment and Unemployment |
08/01/2025 | Updated Data | The USDA Farmers' Market point data has been updated to 2025. New filters for food access programs and special production methods. | Quality of Life > Food Access Locations > Farmers' Markets |
07/30/2025 | Updated Data | Data on Bridges in Poor Condition from the U.S. Department of Transportation has been updated to 2025. This data is available as a point dataset and a layer displaying the counts/percent of all bridges in poor condition at a geography. | Economy > Infrastructure > Transportation |
07/29/2025 | NEW DATA | CRA small business and small farm loan data is updated through 2023. This is a full data refresh, adding more historical data to the "Leading Lenders." This includes the expansion of lending from the banks over time. | Lending > Small Business Loans > Small Farm Loans |
07/22/2025 | Update Data | Data on point-in-time estimates of the homeless population from HUD's Annual Homeless Assessment Report (AHAR) have been updated to 2024. | Demographics > Homelessness |
07/21/2025 | Updated Data | CMS Medicare data has been updated through 2023 and is available to all users. This update includes 5-year percent change. | Health > Cost and Insurance > Medicare |
07/18/2025 | Updated Data | The CRA Eligibility Criteria dataset has been fully updated for 2025. Earlier this month, the first half of this dataset was updated (i.e., Distressed and Underserved census tracts). Now, the second half of this dataset has been updated with 2025 Median Family Income and Area Median Income data. | Federal Guidelines > Additional Federal Guidelines > CRA Eligibility Lending > CRA, CDFI, NMTC Programs > CRA Eligibility |
07/15/2025 | Updated Data | Feeding America's Map the Meal Gap has been updated through 2023 and is available to all users. This update now includes food insecurity data disaggregated by race/ethnicity (Black, Hispanic, White non-Hispanic) as well as older adult and senior food insecurity at the state level. This data now has expanded descriptions and multi-indicator info bubbles. | Income & Spending > Food and Nutrition > Food Insecurity |
07/14/2025 | NEW DATA | The Credit Insecurity Index data has been newly added to PolicyMap. This data from the Federal Reserve Bank of New York measures the ability of households to access mainstream credit and keep current on debt payments. It does so by focusing on two main factors: having a credit score or credit file, and experiencing credit constraints (such as a low credit score, a delinquent payment history, over-utilized credit lines, or a lack of revolving credit). The overall index score is the default layer on PolicyMap. Change the variable in the legend to find: Not Credit Included and Credit Constrained. By breaking down the score into its two components, users can easily identify the specific drivers of credit insecurity, which can vary considerably across states that may have similar overall index scores. The Credit Insecurity Index indicator bubble and as its own layer, there are "Credit Tiers," which offer another dimension of score ratings to demonstrate how credit constrained a community is relative to other communities in the United States. | Lending > Credit Insecurity Index |
07/10/2025 | Updated Data | Annual and Quarterly Home Sales data from Black Knight has been updated to 2024 and 2025 Q1. | Housing > Home Sales |
07/07/2025 | Updated Data | Centers for Medicare & Medicaid Services (CMS) and Health Resources Services Administration (HRSA) – Hospital Compare: Quality of Care has been updated through 2025. | Health > Health Facilities Locations > Hospitals |
07/03/2025 | Updated Data | HRSA Hospitals and Nursing Facilities point datasets have been updated through 2025. This update expands the offering to include four new datasets: Home Health Agencies, Mental Health Services, Federally Qualified Health Centers, and a broader “Other Facilities” category, which features filterable types such as Rural Health Clinics and Hospice Centers. These datasets now include enhanced info bubbles and filtering options. | Health > Health Facilities Locations |
07/02/2025 | Updated Data | This update includes FFIEC's 2025 release of Distressed and Underserved census tracts (using the 2024 Median Family Income and Area Median Income calculations). Due to different data release dates, this dataset is usually updated twice a year. For more information, visit our data dictionary on the CRA. | Federal Guidelines > Additional Federal Guidelines > CRA Eligibility Lending > CRA, CDFI, NMTC Programs > CRA Eligibility |
06/23/2025 | NEW DATA | Claritas Prizm Premier is on production and updated to 2025! Description: Claritas PRIZM® Premier classifies every U.S. household into one of 68 consumer segments based on household preferences for a broad range of products and behaviors. The 14 Social Groups of PRIZM Premier are based on urbanicity and affluence, two important variables used in the creation of PRIZM Premier. The 11 Lifestage Groups are based on affluence and a combination of householder age and presence of children. PolicyMap aggregated the 68 consumer segments based on key demographic groupings provided by Claritas, including household income, household composition (e.g., presence of children), and age of householder. These demographic categories are not mutually exclusive, meaning they describe the predominant characteristics of each segment rather than strict definitions. To find the overall median income for each category, PolicyMap calculated the median of all the segment-level medians within each group. | Curated Collections |
06/20/2025 | NEW DATA | New point data displaying Medicare Accepting Provider locations from CMS has been added to PolicyMap. This data was created using CMS’ national downloadable file, which includes individual-level data on medical providers that accept Medicare. Points were created by grouping together providers of the same specialty and aggregating providers of the same type at the same location.
Due to the large number of provider sub-specialties, many steps were taken to aggregate sub-specialties as best as possible. First, in the taxonomy providers are grouped under 7 categories: General Providers, Internal Medicine and Sub-specialty Providers, Specialist Providers, Surgeons, Dentists and Dental Specialists, Psychiatry and Behavioral Health Specialists, and Other Medical Providers. Within each taxonomy group, sub-specialty groups can be found in the filter and info bubble. Highly specific sub-specialties, such as “CARDIAC ELECTROPHYSIOLOGY” were grouped under more generic and recognizable specialties, such as “Cardiology”. This generic group is what appears in the filter, but the original sub-specialty can still be found in the info bubble under “Provider Information”. For any questions, please refer to the data dictionary. | Health > Access to Medical Care > Medicare Accepting Provider Locations |
06/17/2025 | Updated Data | The HUD LIHTC dataset has been updated through 2023. There are several new columns and filter edits, including a new status change column. | Housing > Housing Locations |
06/17/2025 | Updated Data | Annual and Monthly Building Permit data from the Census Bureau have been updated to 2024 and April 2025, respectively. | Housing > Residential Buildings and Quality > New Building Permits |
06/10/2025 | Updated Data | Pharmacy location data from Data Axle has been updated to 2025. This update includes a new filter, “Store Status”, that can be used to identify pharmacies that closed between August 2024 and May 2025. This was created by identifying pharmacies that existed in data provided by DataAxle in 2024, that no longer exist in our most recent data. This is an assumption by PolicyMap that the pharmacy location closed and is only inclusive of pharmacies included in the data provided by DataAxle. For more information, please refer to the data directory. | Health > Health Facility Locations > Pharmacy Locations |
06/02/2025 | Updated Data | The BLS Local Area Unemployment Statistics (LAU) annual data has been updated to 2024. The BLS LAU monthly data has been updated for October 2024 - April 2025. For the monthly data, Connecticut counties data is unavailable prior to 2020 due to boundary changes introduced by BLS. Data for Connecticut is available 2020 onward at the new county-equivalent, planning region boundaries. | Economy > Employment and Unemployment |
05/29/2025 | Updated Data | The Consumer Spending Habits estimates are now updated to 2023. This is a PolicyMap exclusive dataset utilizing BLS CES and Census Bureau ACS data. | Income & Spending > Consumer Spending Habits |
05/16/2025 | Updated Data | HUD Difficult Development Areas (DDAs) and Qualified Census Tracts (QCTs) are updated to 2025. | Federal Guidelines > Housing and Urban Development |
05/08/2025 | Updated Date | Median Age Percentile Rankings based off the recent ACS update have been added to PolicyMap. These rankings measure the median age of a geography’s population, compared to all other geographies at the same level. Percentile are ranked from 0-100, where a low rank indicates a low median age compared to all other geos. For instance, a rank of 20 would indicate that the median age of the population is lower than 80% of all other geos. However, this does not mean that the median age of the population is 20 years old. | Demographic > Age |
05/06/2025 | NEW DATA | Niche is a platform that provides rankings for schools based on public data and user reviews. PolicyMap licenses Niche ratings for Pre-K through 12th grade schools. The Overall Rating and Academic Rating are based on Niche’s proprietary algorithms and follow a grading scale from A+ to D-. Niche is replacing GreatSchools, with key differences including the incorporation of data on school demographics, administrative details, graduation rates, AP course offerings, etc. Niche also includes user-reported data on metrics such as average GPA, SAT/ACT scores, and AP exam pass rates. With the additional data from Niche, we were able to expand the point dataset filters and expand the distance to nearest high performing public school to include separate layers for pre-k, elementary, middle, and high school. | Education > Education Locations > School Performance Education > School Rating Performance |
05/02/2025 | Updated Data | HUD Multifamily and Public Housing point datasets have been updated to 2024. | Housing > Housing Locations |
05/01/2025 | Updated Data | Bank branch office data from FDIC has been updated to 2024 data. | Lending > Banking Locations |
04/28/2025 | Updated Data | Credit Union Branch locations from NCUA has been updated to 2024 data. | Lending > Banking Locations |
04/28/2025 | NEW DATA | FEMA Disaster Assistance has been published on production. This dataset is broken in three categories in the taxonomy: Individual & Household Assistance, Public Assistance, and Property Damage. This was created using data from FEMA’s Individual & Households (IHP) and Public Assistance (PA) programs. Each category includes a layer for all disasters, and disaster-specific layers. Specific information on the base later and info bubbles can be found at the bottom. Please feel free to reach out if you have any questions about this data.
Individual & Household Assistance: Base layer displays the total amount of funding provided through the IHP program. Info bubble includes additional information on the number of disasters, funding provided through sub-programs of the IHP, and details on emergency needs and assistance provided to applicants. Public Assistance: Base layer displays the total amount of funding provided to grantees through the PA program. Info bubble includes the number of disasters, total number of grant projects, and details on the total cost of the projects. Property Damage: Base layer displays the total determined cost of damage caused to real property components. Info bubble includes the number of disasters, determined value of damage to specific property components, and determined level of damage to renter/owner properties. | Quality of Life > FEMA Disaster Declarations > FEMA Disaster Assistance |
04/21/2025 | NEW DATA | Ancestry Data for AIAN Populations: A new ancestry table for American Indian and Alaska Native alone populations, now based on selected tribes and villages (no longer grouped, per tribal consultation feedback).
Expanded Age and Sex Breakdowns: More detailed age data, including breakdowns by sex and a new proxy indicator for females of reproductive age (15–49).
Disability Data: Disability indicators now further disaggregated by age, sex, and veteran status.
| Demographics |
04/21/2025 | NEW DATA | Education Data: New indicators include age and sex disaggregation for educational attainment and school enrollment.
| Education |
04/21/2025 | NEW DATA | Seniors Data: New indicators on poverty status, SNAP participation, and employment status for older adults.
| Income & Spending |
04/21/2025 | NEW DATA | Medicaid and Medicare Data: Expansions on Medicaid enrollment by age groups (under 19, 19–64, and 65+) and by sex, along with Medicare enrollment by sex.
| Health |
04/21/2025 | NEW DATA | Housing Costs by Race & Ethnicity: Nine new race- and ethnicity-specific tables show housing costs as a percentage of household income (>30% and >50%) for owners (with/without mortgage) and renters.
Homeowners Insurance Costs by Mortgage Status: New table provides yearly homeowners insurance costs for both owners with and without a mortgage.
| Housing |
04/21/2025 | NEW DATA | Owner- and Renter-Occupied Housing by Tenure: Expanded indicators include both owner-occupied and renter-occupied units by tenure type.
Homeowner Monthly Costs by Mortgage Status: Details owner‑occupied units’ monthly housing costs by mortgage status.
| Housing |
03/24/2025 | Updated Data | The Institute of Museum and Library Services point dataset for public libraries has been updated to the most recent 2022 year. | Quality of Life > Quality of Life Locations > Libraries |
03/24/2025 | Updated Data | CDFI Investment data has been updated to 2022. It is available to all users and can be found under the Lending > CRA, CDFI, NMTC Programs menu. Please note that in this update, the CDFI Fund included missing investment data from FY2021 that has impacted data for 2020 and 2021. Data availability for these years hasn’t changed, but the values for the number of investments and median investment amount has changed significantly. Details on this have been included in the data directory. | Lending > CRA, CDFI, NMTC Programs |
03/17/2025 | Updated Data | The Centers for Disease Control and Prevention (CDC) & Agency for Toxic Substances and Disease Registry (ATSDR) Environmental Justice Index is now updated on PolicyMap. This new release includes the EJI + Climate Burden rank, which is calculated using the new Climate Burden module along with the three existing modules-- Social Vulnerability, Environmental Burden, and Health Vulnerability. For more detailed information, please refer to the Data Dictionary. | Quality of Life > Environment and Disaster Risk > EJI > Census Tract Ranking |
03/13/2025 | Updated Data | The CDC Mortality data has been updated through 2023. This update includes disease-related deaths for adults 35 and older, as well as injury-related deaths for all ages. Please note that the county maps are very sparse, as county-level data is only available for counties with populations of 250,000 or more. Rates are not displayed in areas with fewer than 10-20 deaths, depending on the indicator. Indicator-specific details on suppression are in the description. Years and geographies with fully suppressed data do not appear in the dropdown selections. The CDC Infant Deaths data has been updated through 2022, and now includes, though very limited, the counts of infant deaths for mothers who were Native Hawaiian or Other Pacific Islander. | Health > Vital Statistics > Mortality Curated Collections > Social Determinants of Health > Life Expectancy and Mortality |
03/07/2025 | Updated Data | Monthly building permit data from the Census has been updated to December 2024. It is available to all users and can be found under the Housing > Residential Buildings and Quality menu. CBSA data has also been added for 2004-2024. | Housing > Residential Buildings and Quality |
03/06/2025 | Updated Data | FEMA Floodmap Types (aka Floodzones) have been updated. | Quality of Life > Environment and Disaster Risk > Flood Risk |
02/27/2025 | Updated Data | Bank Failure data from the FDIC has been updated to 2024. | Lending > Bank Locations |
02/24/2025 | Updated Data | The Owner Affordability and Renter Affordability data has been updated with the current ACS data. This dataset combines HUD Area Median Income (AMI) data with ACS data and is exclusive to PolicyMap. The Area Median Income represents the median income thresholds for a family of four within a geography, as published by HUD in 2023. Housing cost data includes the estimated number of homes falling under specific price thresholds, based on the Census' 2019-2023 ACS data. | Incomes & Spending > Affordability > Housing Unit Affordability Housing > Affordability and Cost Burdens > Affordability |
02/20/2025 | Updated Data | IRS Statistics of Income Migration data is now updated to 2021. This dataset displays estimates of migration flows across counties using domestic and foreign tax returns. | Demographics > Migration > Annual Migration |
02/18/2025 | Updated Data | The Racial Homeownership Gap data has been updated with the current ACS data. This data calculates the gap using percent of owner households by race subtracted from percent of Non-Hispanic White owner households. | Housing > Homeowners and Renters > Racial Housing Disparity |
02/12/2025 | Updated Data | Local Median Income as a share of Area Median Income (Low Mod) has been updated with the current ACS and HUD data. This data shows local Median Household Income (MHI) from the American Community Survey (ACS) (2019-2023) as a percentage of either the HUD-defined Area Median Income (AMI) for metro areas (2023) or the non-metro state AMI (2023) for areas outside Census-defined metro regions. The map categorizes income levels using ACS MHI data and compares it to HUD AMI benchmarks for metro and non-metro areas. | Income & Spending > Low and Moderate Income (Low Mod) |
02/11/2025 | Updated Data | The USDOT Deteriorating Bridges (layer and point) data is updated to 2024. The point data shows the locations of bridges in poor condition, as well as descriptive information like what road the bridge ‘carries,’ bridge length, average daily traffic, year built, and more. The layer data shows a percentage of all bridges in poor condition. | Economy > Infrastructure > Transportation |
02/10/2025 | NEW DATA | The CDFI Fund's New Markets Tax Credit (NMTC) Eligibility has been updated to include a new eligibility criterion: "High Migration Rural County". Census tracts in High Migration Rural Counties with a median family income at or below 85 percent of the applicable area median family income are now NMTC Eligible. A High Migration Rural County is any county which, during the 20-year period ending with the year in which the most recent census was conducted, has a net out-migration of inhabitants from the county of at least 10 percent of the population of the county at the beginning of such period. | Federal Guidelines > CDFI Fund New Markets Tax Credit (NMTC) Eligibility |
02/10/2025 | Updated Data | Area Median Income data from the Department of Housing and Urban Development (HUD) has been updated to 2024. | Income > Area Median Income |
01/30/2025 | Updated Data | Disaster declaration data from FEMA has been updated to January 2025. This includes the Los Angeles wildfires. | Quality of Life > Environment and Disaster Risk > FEMA Disaster Declarations |
01/29/2025 | Updated Data | The Diversity Index and Theil Index data is now updated to the latest ACS time frames (2019-2023, 2014-2018, 2009-2013). | Demographics > Race, Ethnicity, Diversity > Diversity & Segregation |
01/29/2025 | UPDATED DATA | The Census American Community Survey (ACS) data is now updated to the latest time frames (2019-2023, 2014-2018, 2009-2013). It is available to all users. Data can be found under many menus, including: Demographics, Incomes & Spending, Housing, Health, Quality of Life, Economy, Education, Federal Guidelines. | Demographics, Incomes & Spending, Housing, Health, Quality of Life, Economy, Education, Federal Guidelines |
01/17/2024 | Updated Data | The FFIEC HMDA (Home Mortgage and Disclosure Act) data has been updated to 2023. However, this update also includes a small refresh of our historic data to ensure that this dataset will be easier to maintain going forward. We now only show data starting in 2007 since that is the earliest date the FFIEC has data available online. The other key difference is that previous variables that related to prime and high cost/subprime mortgages were divided into two variables divided by time: prior to the 3rd quarter in 2009 and afterward. This reflected a major definition date during 2009Q3. Prior to this date high cost was defined as >= 3 times the APOR and thereafter as 1.5 times the APOR. These variables are now combined to allow for easier use of the data so a user will only see one variable instead of two for each of these categories. Caution should be made when comparing these variables after the definition change in 2009. Users will see that percent change variables will be missing for any variables that include this definition and span this definition change. | Lending > Mortgage Loans |
01/15/2025 | Updated Data | HIV diagnoses and prevalence data from the CDC has been updated to 2022. | Health > Health Conditions > Infectious Disease |
01/15/2025 | Updated Data | CDFI Fund Persistent Poverty Counties data has been updated to the latest 2024 release. | Federal Guidelines > Additional CDFI Fund Programs |
01/14/2025 | Updated Data | The HMDA home mortgage dataset from FFIEC is now updated to 2023. | Lending > Mortgage Loans |
01/10/2025 | Updated Data | Natality data from the CDC has been updated to 2023. | Health > Vital Statistics > Birth and Prenatal Care |
01/09/2025 | Updated Data | The 119th Congressional Districts were added to the Boundaries menu. | Boundaries |