Points with Layer Download (Modal)
![]() Updated
by
PolicyMap
Updated
by
PolicyMap
- Example 1: We want to find a list of high schools that are in school districts with the highest graduation rates in Oregon.
- Example 2: In our next example, let’s say you want to find the Congressional Member who represents each university in Virginia.
- Example 3: Finally, users can determine which addresses in their investment portfolio are in locations that are eligible for a federal program like the New Markets Tax Credit.
As stated on the Data Download tutorial, the Points with Layer Data feature is the unique ability to find the geography and data that an address sits. For our advanced GIS users, this will join an address to a geography and give the FIPS code and data for that geography.
These examples are using the Modal download. Select the  download icon to open the modal to start.
Example 1: We want to find a list of high schools that are in school districts with the highest graduation rates in Oregon.
- In Select Data,
- Use the
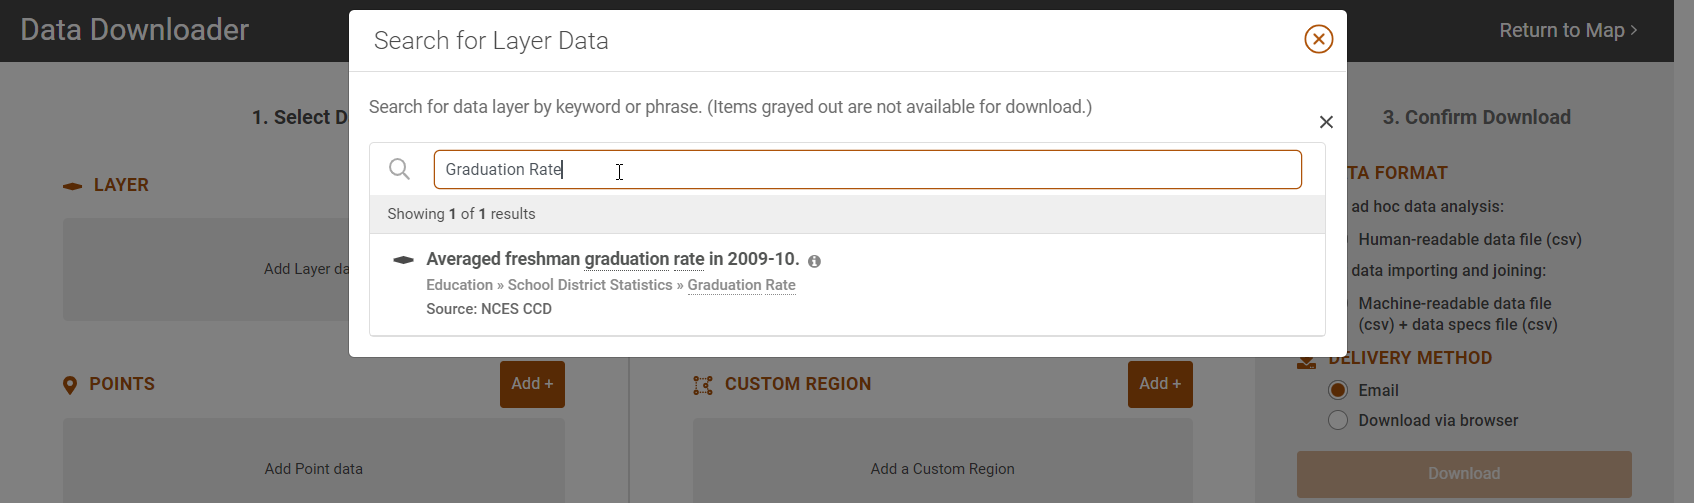
 Add button in Layer to search for Graduation Rate and select Average freshman graduation rate in 2009-10 from NCES CCD.
- Use the
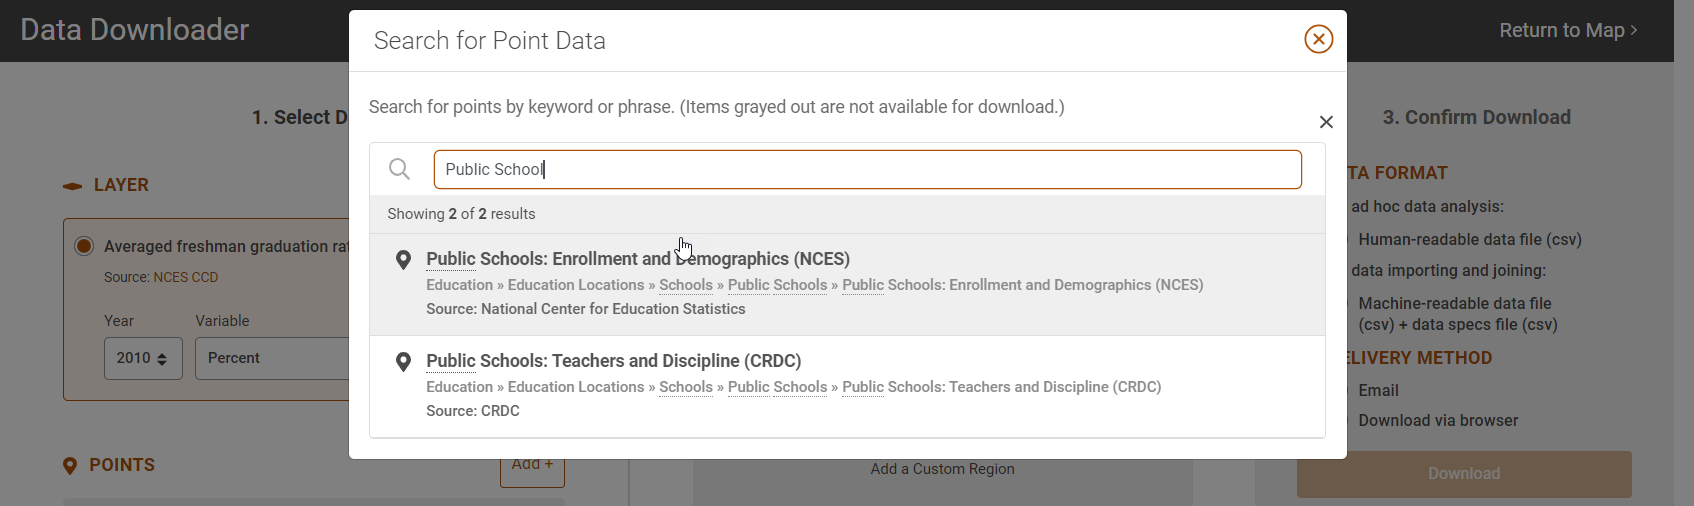
 Add button in Points to search for Public Schools and select Public Schools: Enrollment and Demographics (NCES)
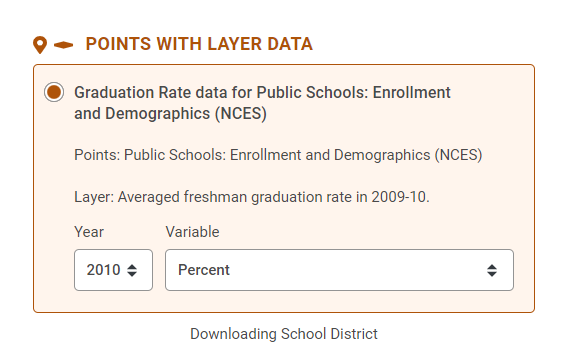
- Choose the Points with Layers option which will now state "Graduation Rate data for Public Schools: Enrollment and Demographics (NCES)"
- In Select Location, use the
 Add button to search for Oregon
- The default and only geography for graduation rate is School District.
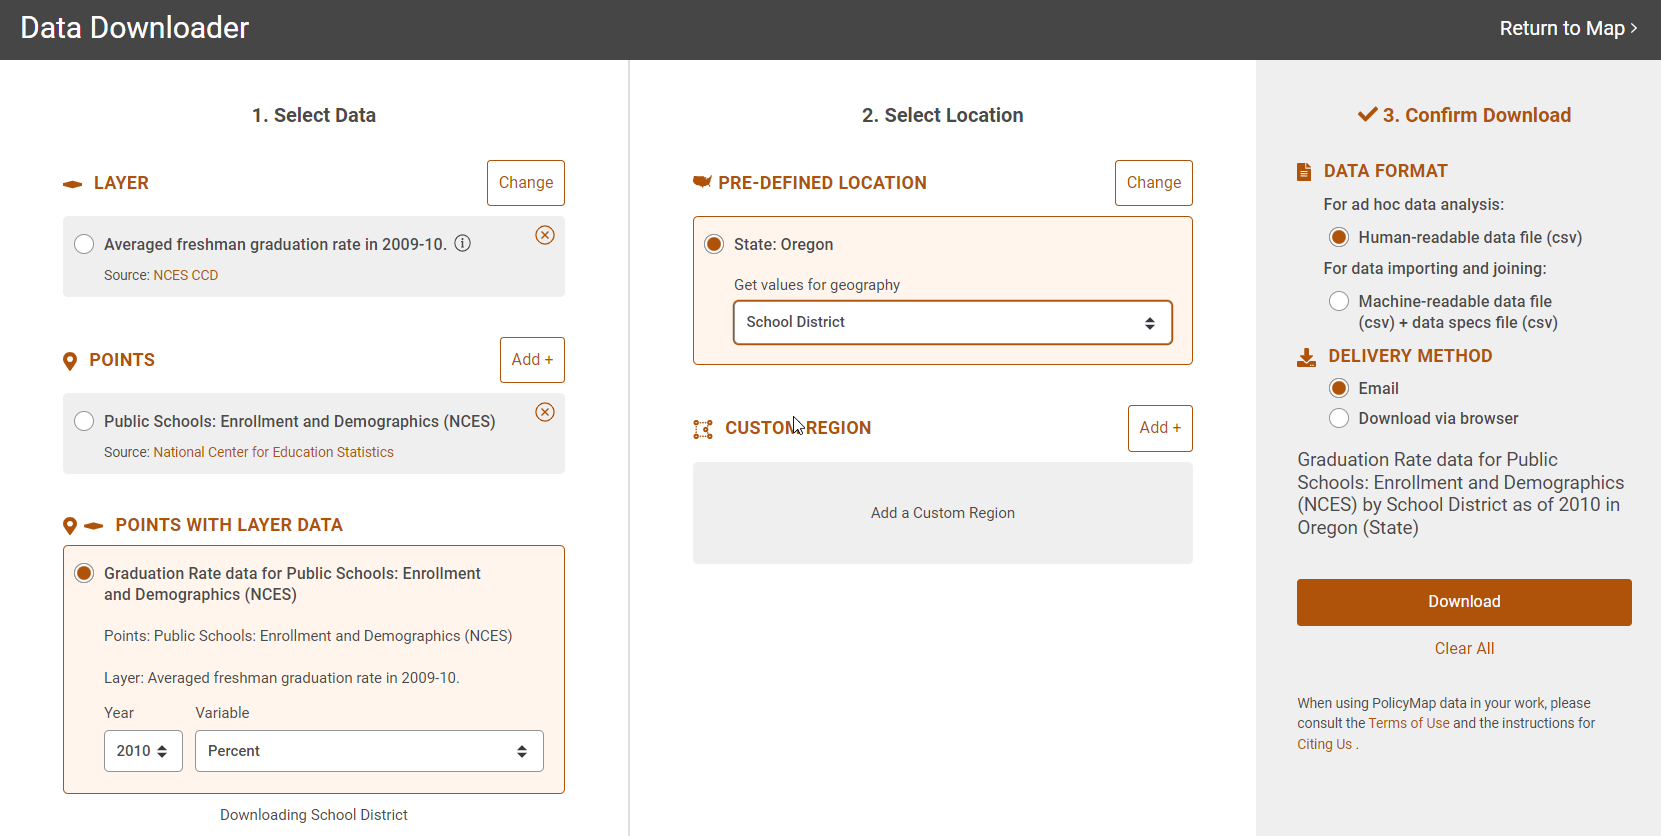
- • Select Download Data.
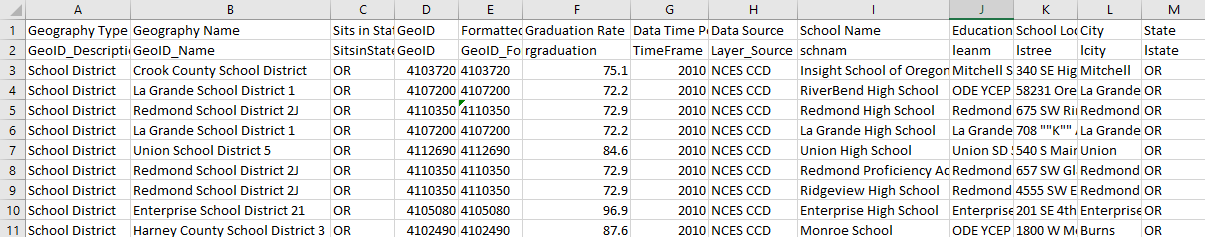
- The file will show each high school (column I) with the school district (column B) and graduation rate (column F) for the districts.
Example 2: In our next example, let’s say you want to find the Congressional Member who represents each university in Virginia.
- In the Select Data,
- Use the
 Add button in Layer, to search for any data layer which has Congressional district aggregations (most Census datasets have this aggregation), so we will search for Population.
- Use the
 Add button in Points, to search for University and load 4-Year Colleges and Universities.
 - Choose the Points with Layers option which will now state "Population data for 4-Year Colleges and Universities"
- In the Select Location,
- Use the
 Add button to search for Virginia
 - Change the Shade By to Congressional District
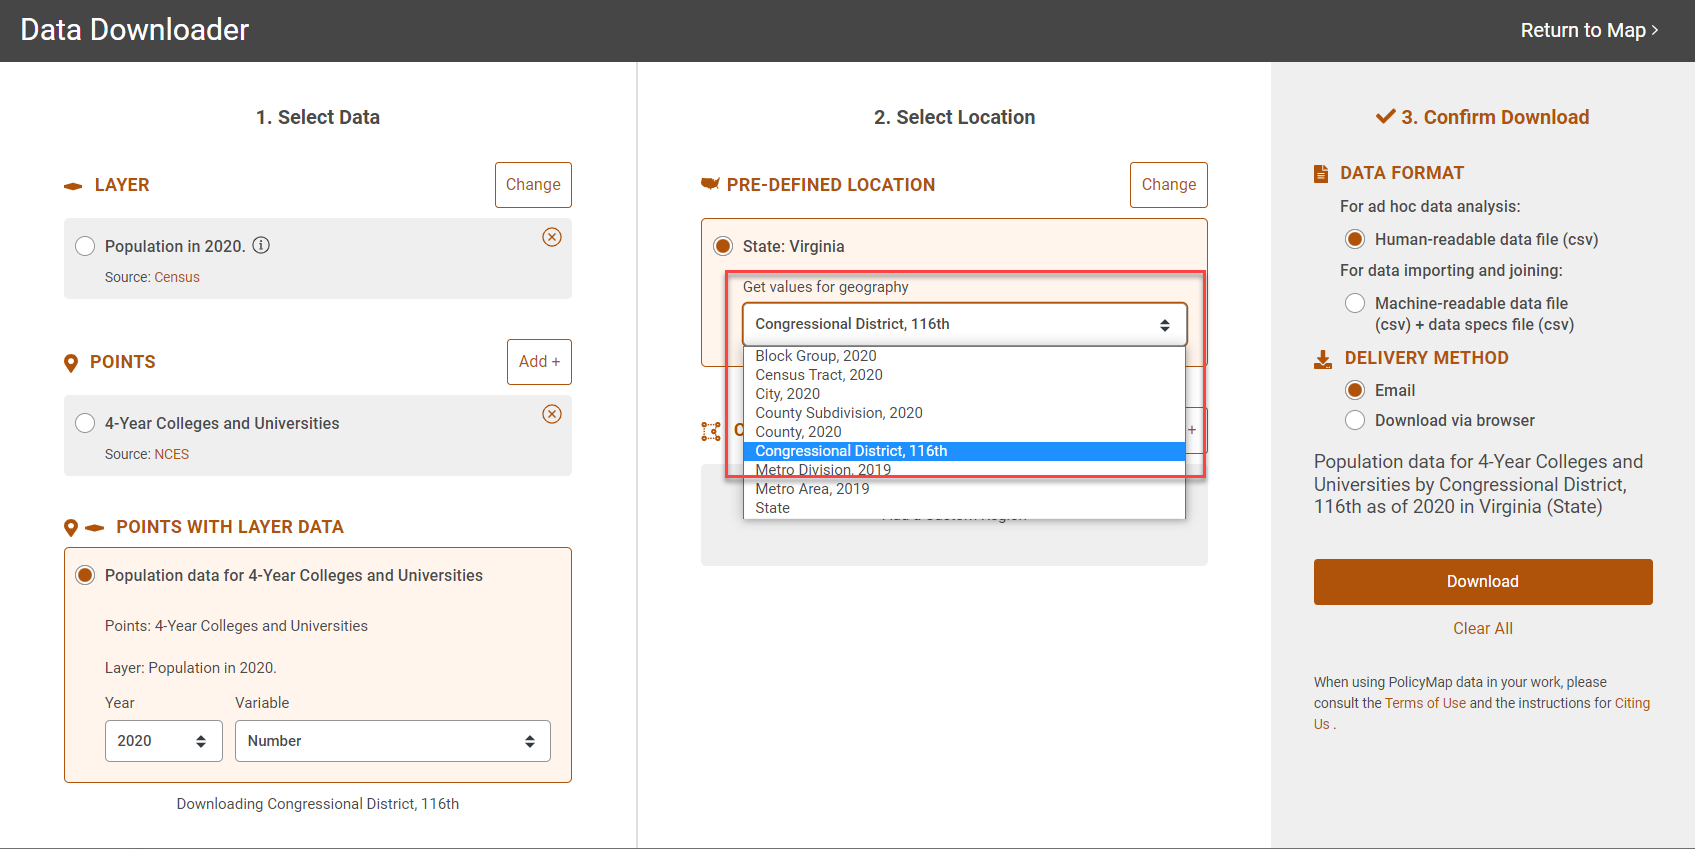
- Select Download Data
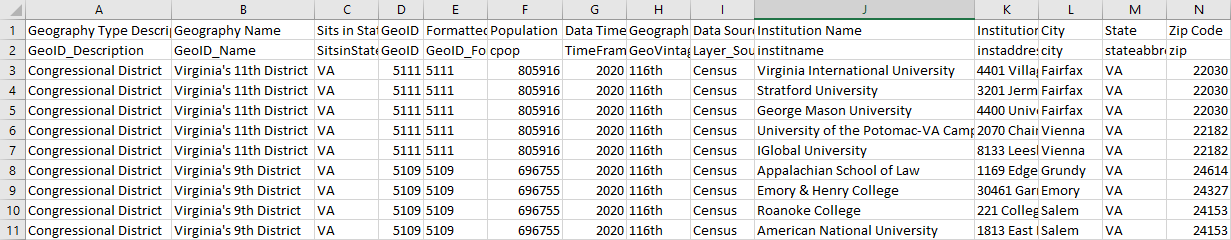
- If you disregard the Population and Data Time columns, you now have a list of all universities in Virginia (column J) and the Congressional District (column B) the school is in.
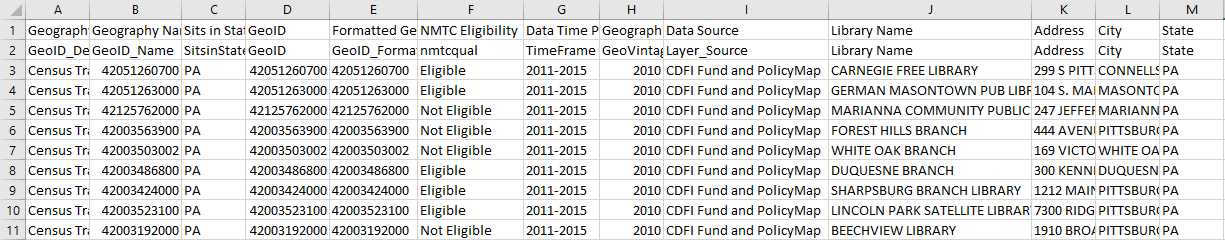
Example 3: Finally, users can determine which addresses in their investment portfolio are in locations that are eligible for a federal program like the New Markets Tax Credit.
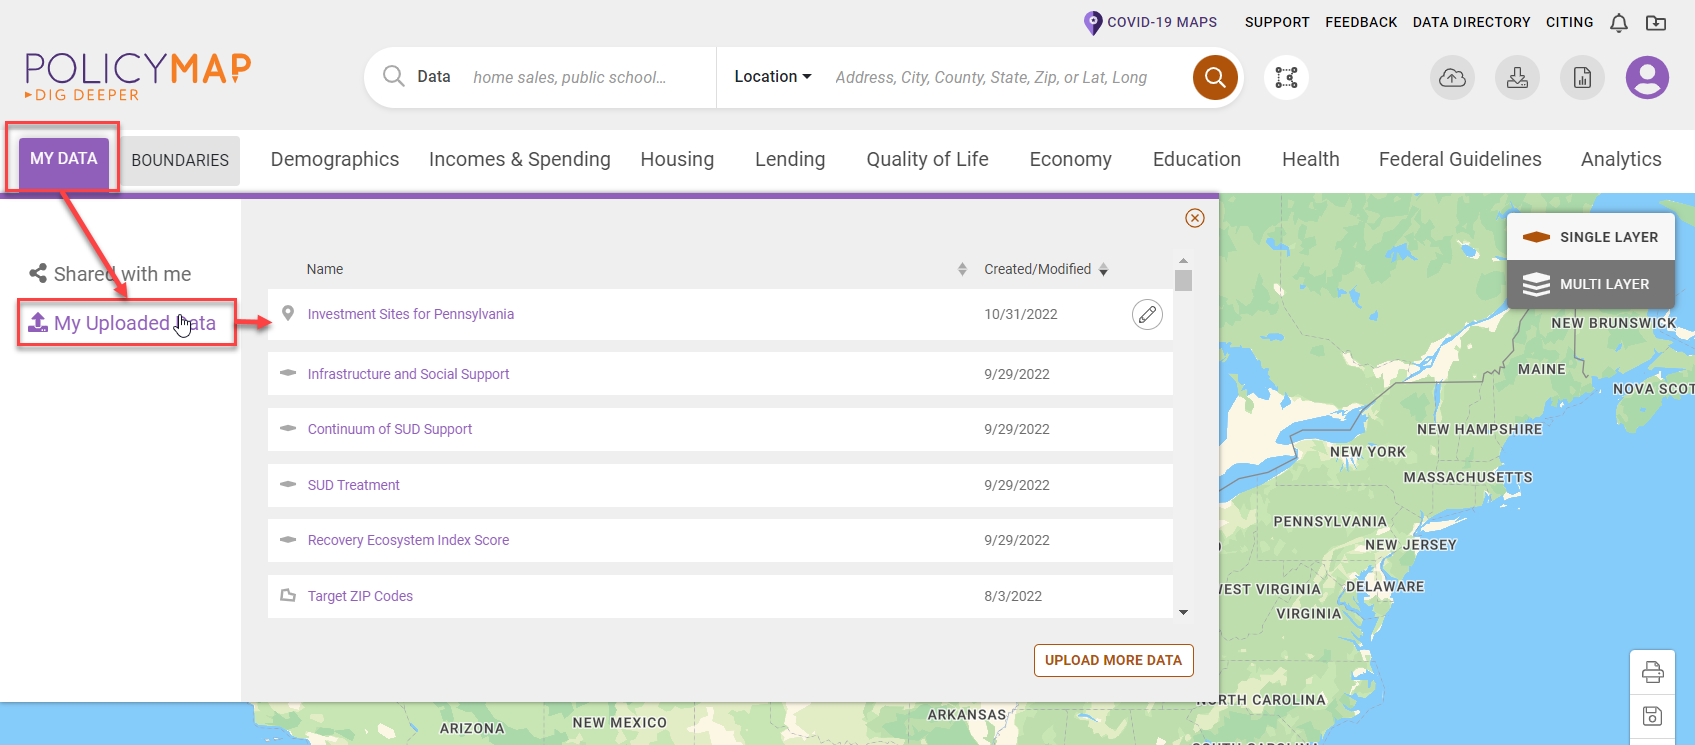
- Use the Data Loader to upload your addresses into PolicyMap first. on the Maps page, add your dataset from the My Data tab.
- Select the icon to open the Data Download modal, the dataset load from My Data will already appear in the Points section.
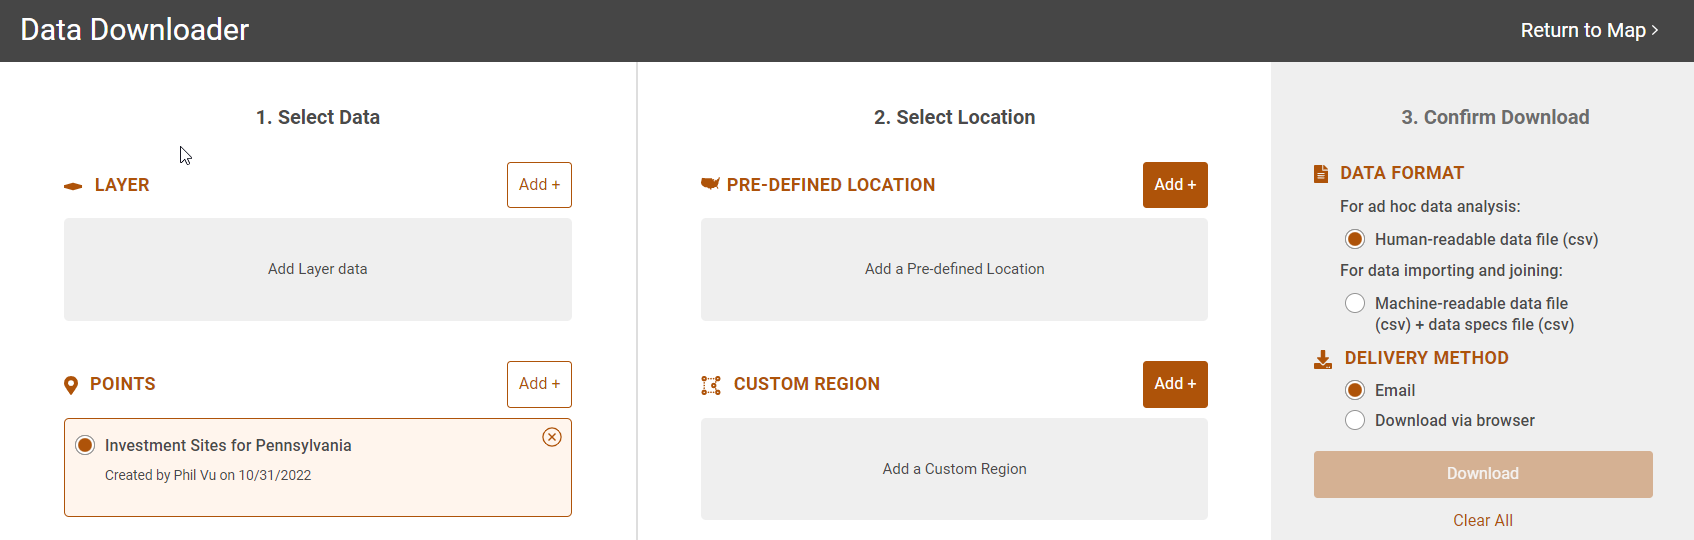
- In Select Data,
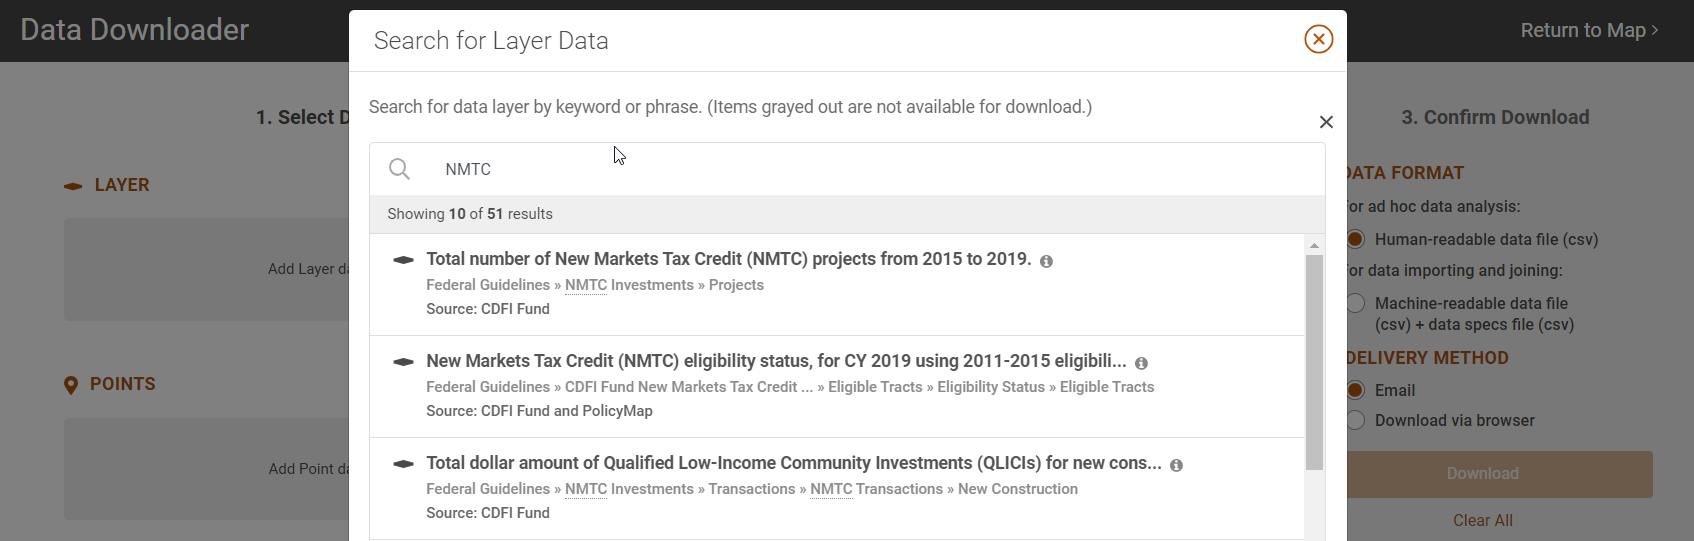
- Use the Add button to search for a program, in our example we will search for NMTC and select "New Markets Tax Credit (NMTC) eligibility status, for CY 2019 using 2011-2015..."
- Choose the Points with Layers option which will now state "NMTC Eligibility data for [Name of your dataset]"
- Change the year or variable if needed
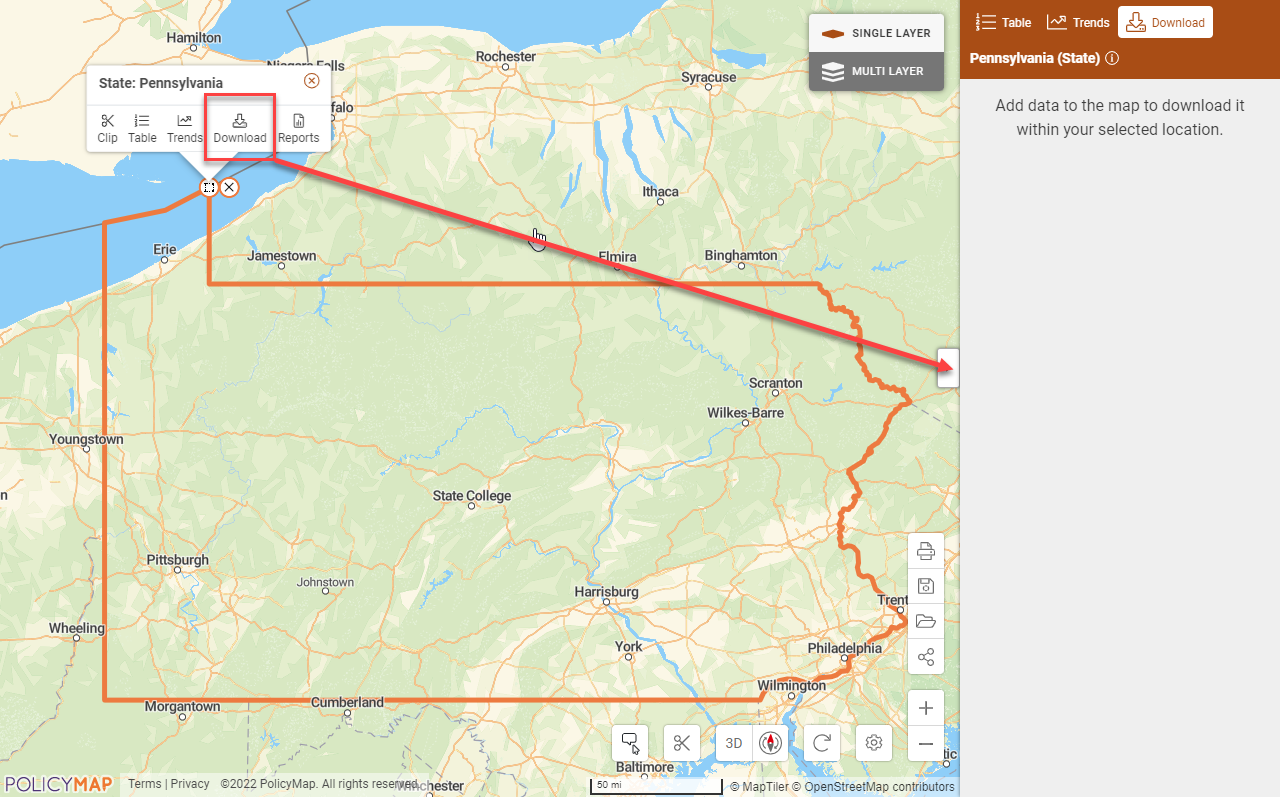
- On the Maps page, search for Pennsylvania in the location bar and select the Download icon to open the Sidebar.
- Add your dataset onto the map from the My Data tab
- Add an eligibility data layer for a federal program
• We will use the CDFI Fund’s New Markets Tax Credit program under Federal Guidelines
- Select Points with Layer which should state, “NMTC Program Eligibility data for [dataset name]...”
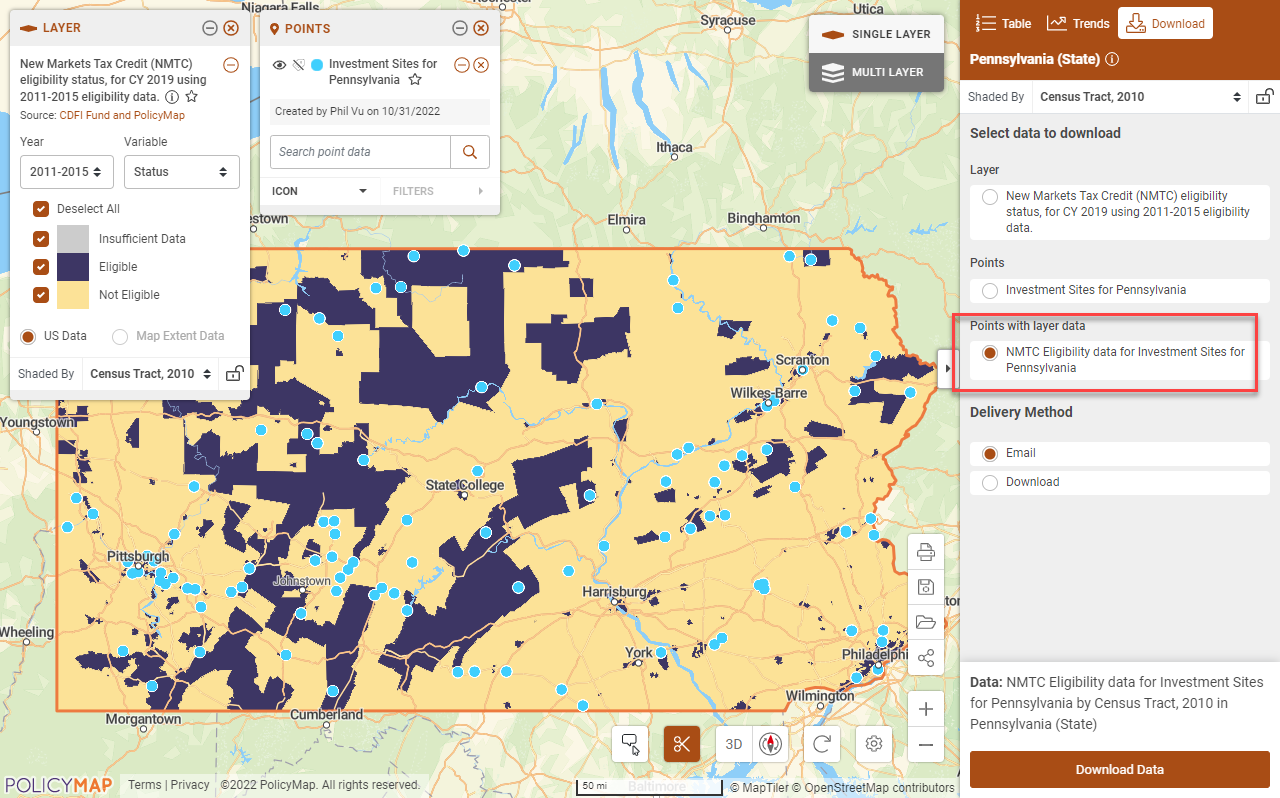
- Select Download Data
- The file will show the Census Tract, the FIPS ID, if it’s eligible for New Markets, and the rest of your address data.
These are just a handful of examples that you can use the Points with Layer feature for. With over 60,000 data layers and hundreds of thousands of address, the combinations are endless. We hope this tutorial gives you some ideas on how to use the unique Points with Layer feature.
If you have any questions or want to lean more, visit our training calendar and attend a free session or contact us at any time.