Selecting PolicyMap Data
![]() Updated
by
PolicyMap
Updated
by
PolicyMap
Once you have completed the Admin Setup, you will now need to select the data to display in the Index Card and Reports. Go into your Salesforce and select the new PolicyMap tab (added in Step 5 of the Admin Setup). Select Administration and Settings
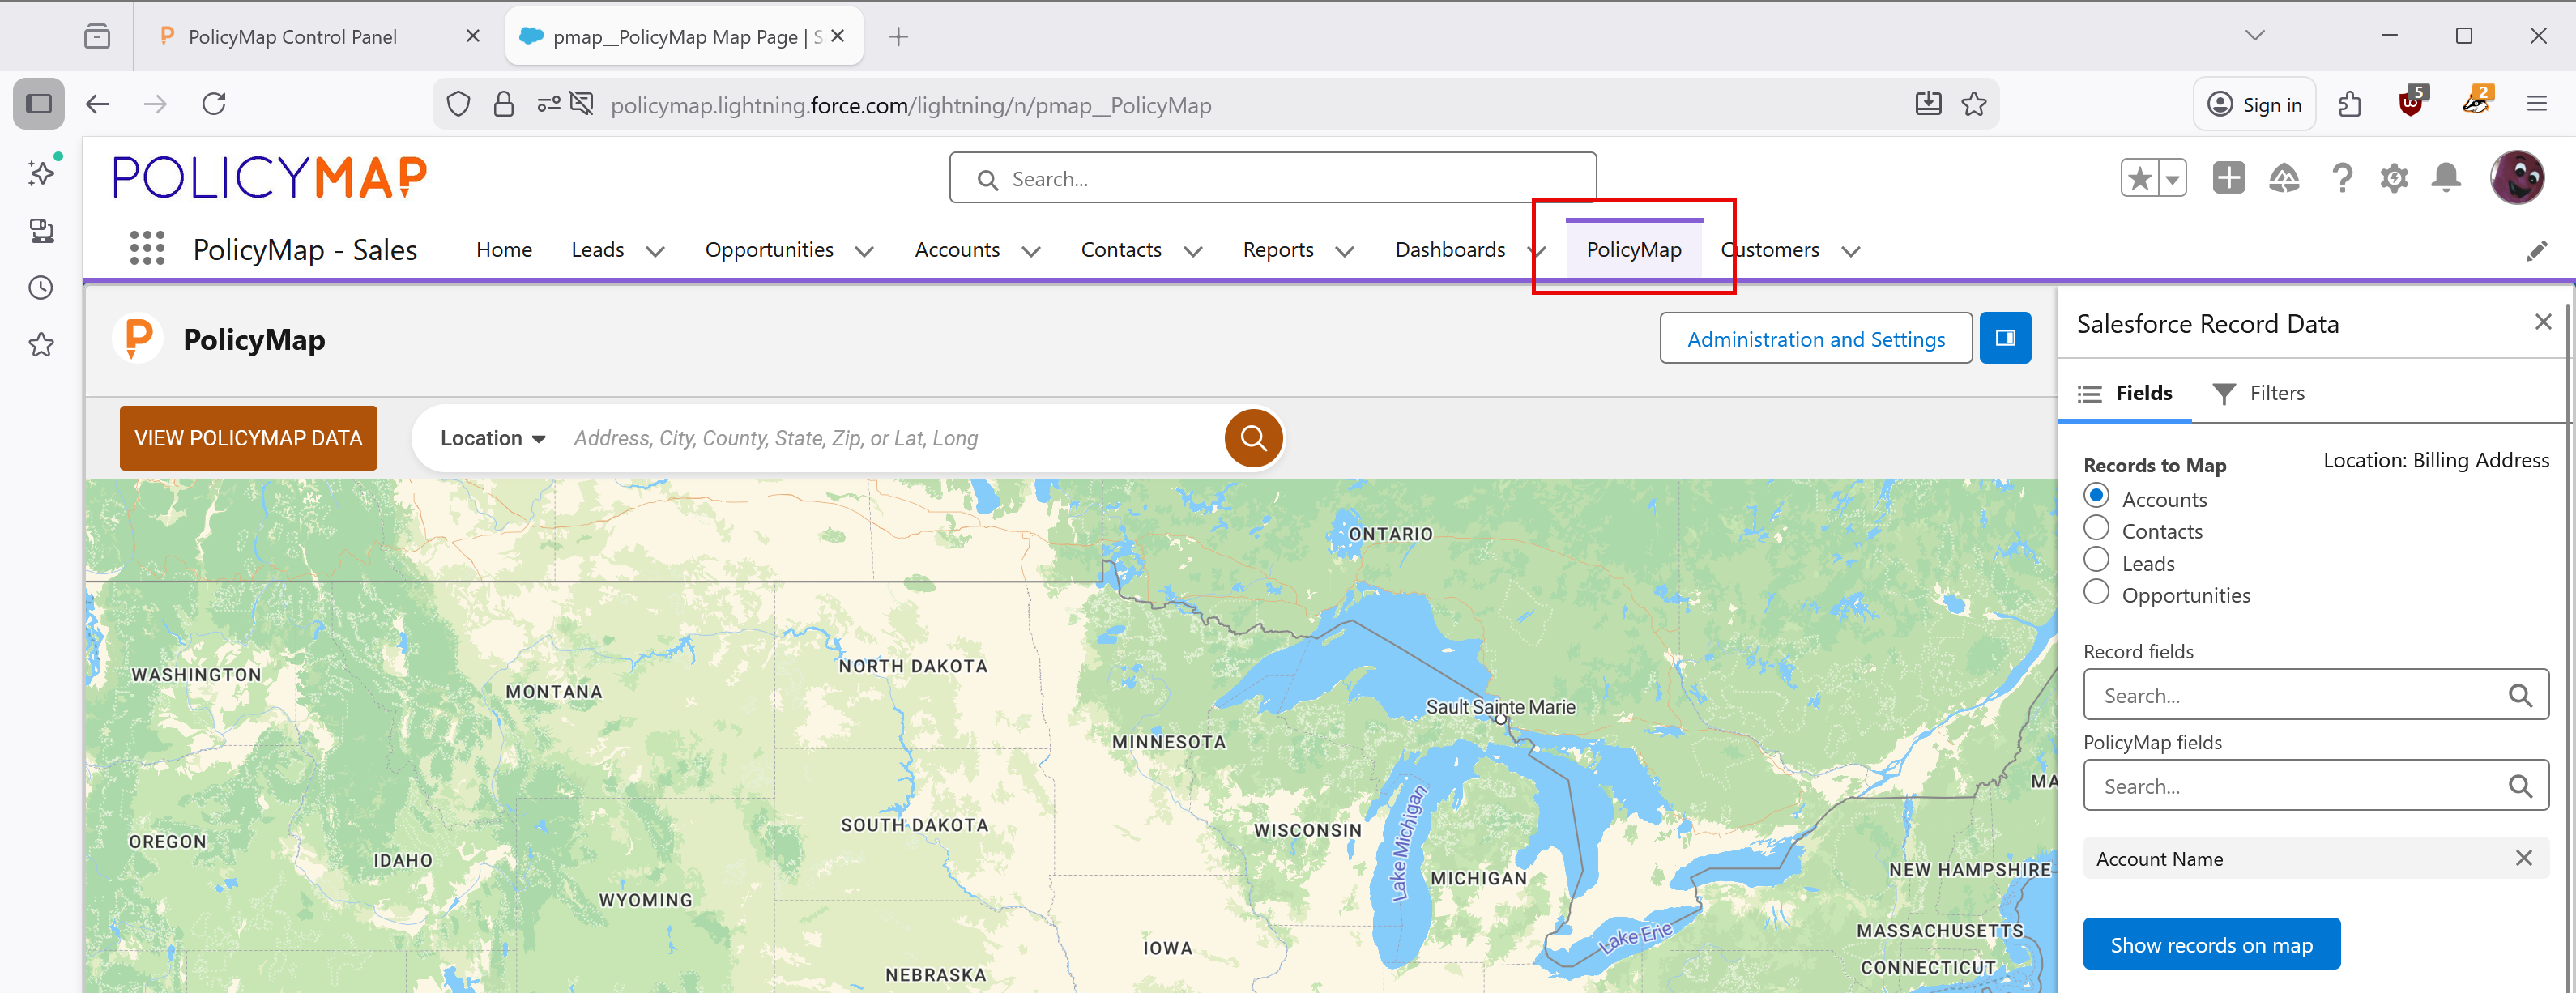
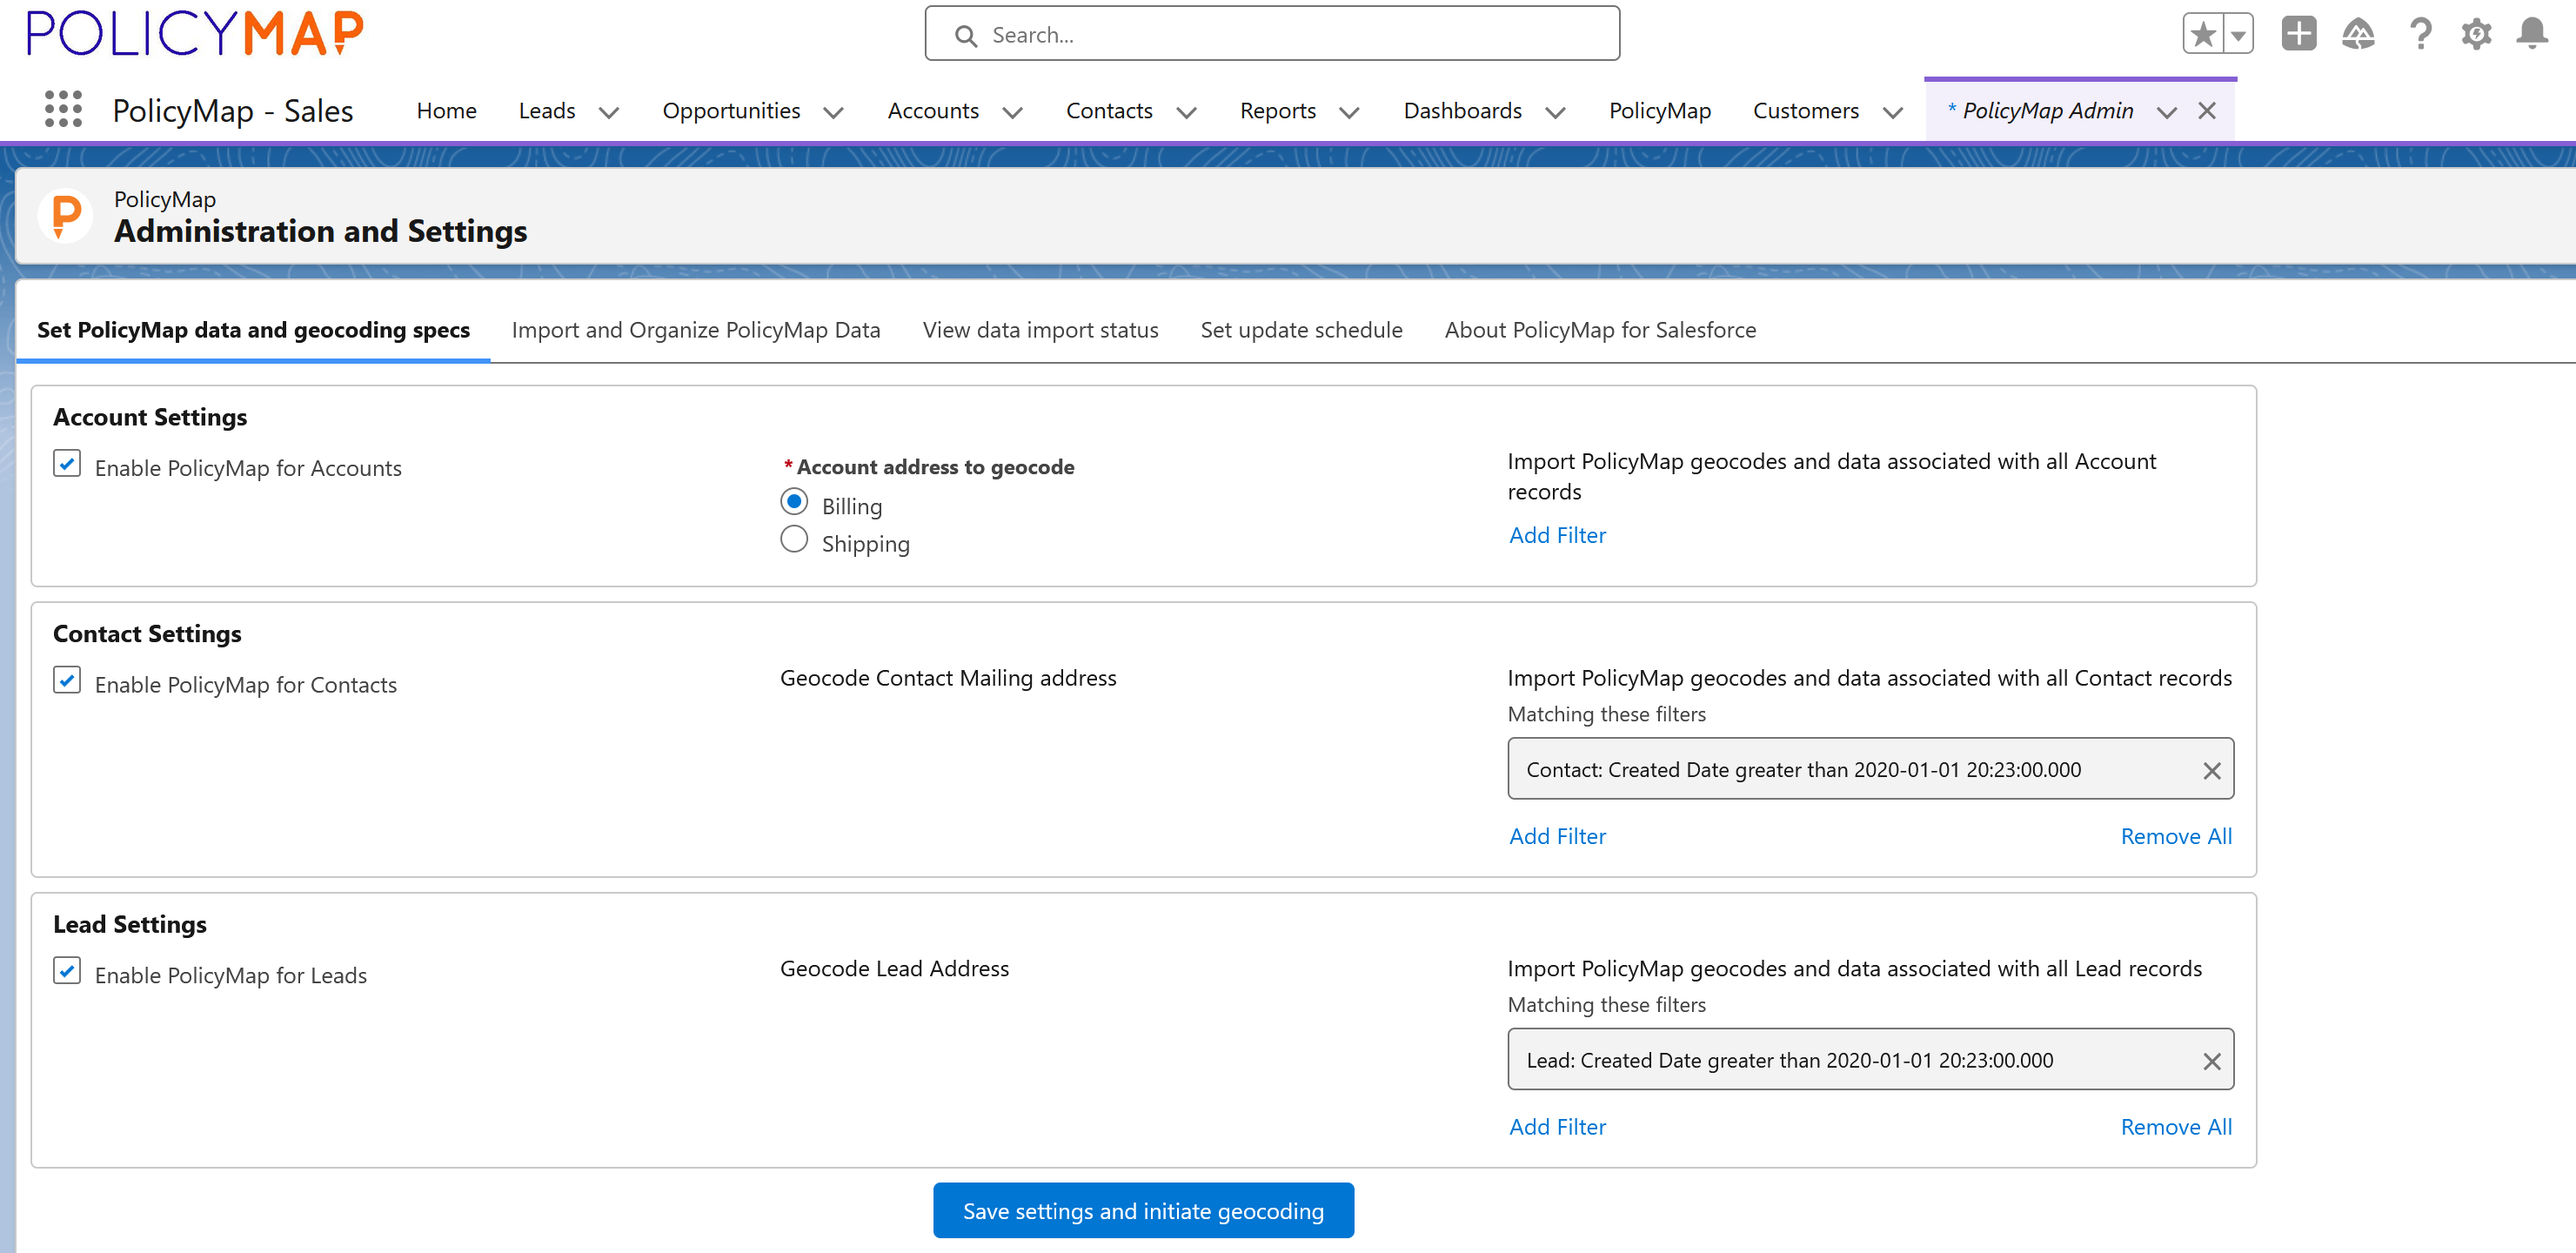
- Set PolicyMap data and geocoding specs - Select which object to enable PolicyMap to geocode the address and add data to.
- Accounts can use the Billing or Shipping address, while Contacts and Leads have only one address field.
- Use the Filter function to capture a subset of addresses. Because organizations could have a large number of Contacts and Leads, we suggest using the filters to reduce the total number to capture and load.
- In this example, the filter is set to capture only Contacts and Leads created as of 01/01/2020.
- Import and Organize PolicyMap Data - This page displays the selected PolicyMap data and allows adding more PolicyMap data.
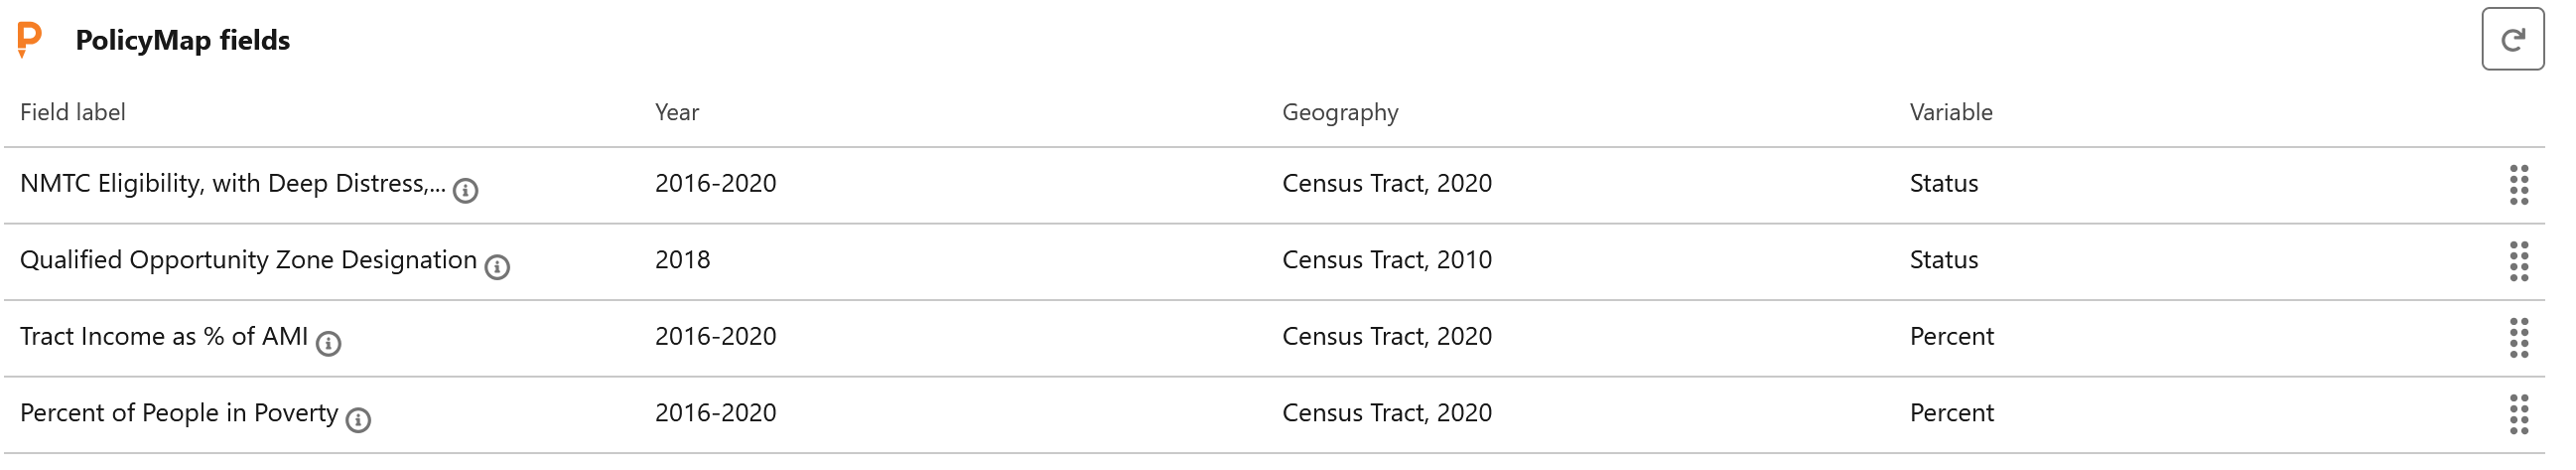
- PolicyMap Fields - This will display any data currently added to the Index Card and Reports.
- Field Label is the name of the data. Mouse over the
 icon to view a more detailed description of the data.
 - Year is the selected year for the data.
- Geography is the location the data is associated with (i.e., zip code, county, state, census tract, etc.). The year after the geography is the year the geography was created.
- Variable is the type of data displayed for the geography (i.e., Number, Percent, Status, etc.).
- Use the eight-dot button
 to reorder the data.
 - To Delete data from the Index Card and Report, follow the steps here.
- Field Label is the name of the data. Mouse over the
- Request Data - Choose PolicyMap Data to import into the Index Card.
- Layer - Select the box to see a list of available data for your data package. Data is grouped by "family of indicators". Use the box to search for a data indicator by keyword.
- Variable - Once data is selected, choose what type of value the data is displayed at (i.e., Number, Percent, Percent Change, Status, etc.). Please note that variable options vary based on the data selected.
- Year - Choose which year of the data to display. PolicyMap has data starting from 2000. Please note, years that are hyphenated (i.e., 2016-2020) are data commonly from the Census's American Community Survey, which is a 5-Year Rolling Estimate.
- Geography - Select what geography to display the data for.
- Layer - Select the box to see a list of available data for your data package. Data is grouped by "family of indicators". Use the box to search for a data indicator by keyword.
- PolicyMap Fields - This will display any data currently added to the Index Card and Reports.
- View data import status - This page shows the status, history, and any errors or updates for data requests. Mouse over the
 icon for more information on which data was requested.
 - Set update schedule - New records added to your Salesforce do not automatically have data populated from PolicyMap. You can use the scheduling tool to set a start date, start time, and frequency for updating new records. Depending on how often your organization adds new records, set the frequency to reflect that update.
- About PolicyMap for Salesforce - General information about the PolicyMap for Salesforce app is available here. For a more technical walkthrough of the tool, you can visit the Technical Review page.