Sidebar Tables
![]() Updated
by
PolicyMap
Updated
by
PolicyMap

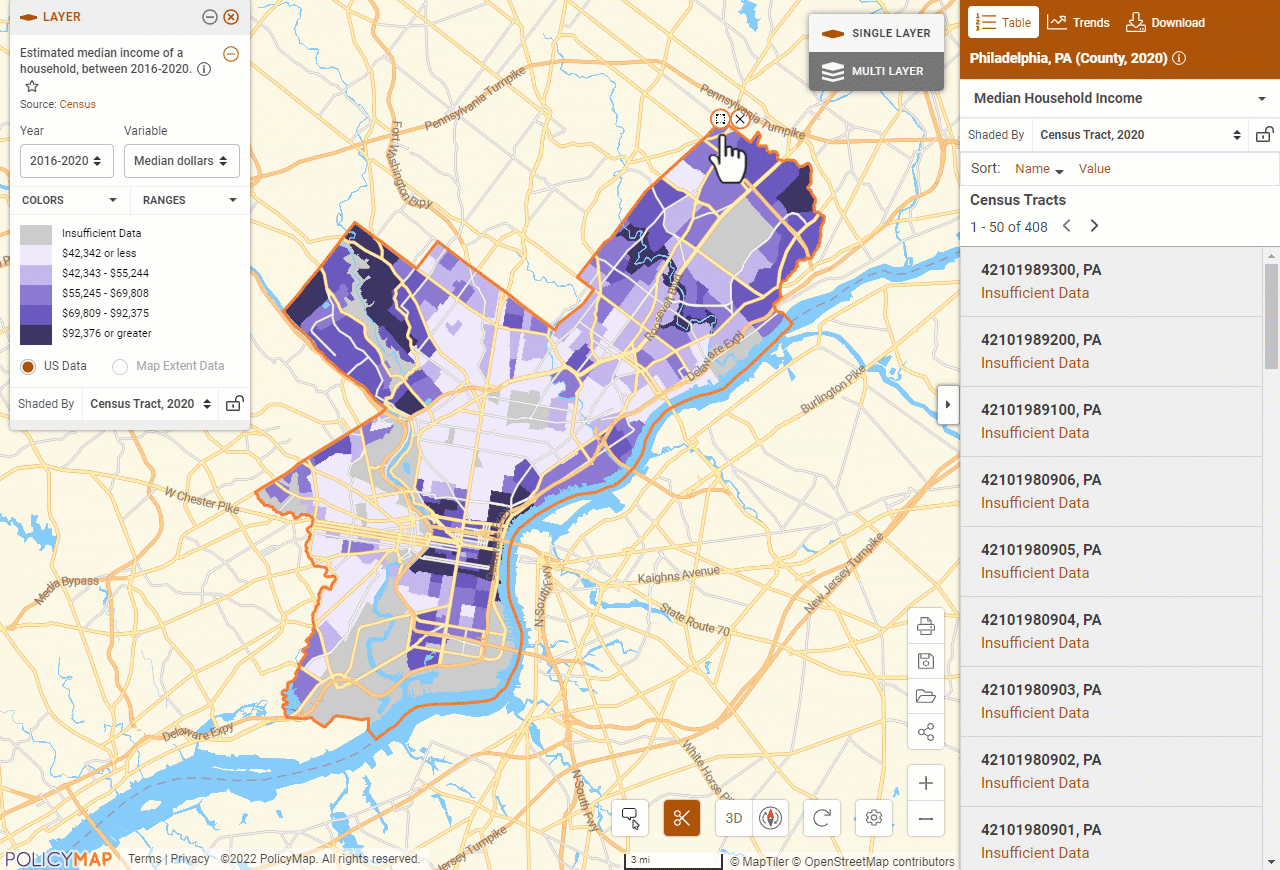
The Table feature of the Sidebar will show a list of geographies contained by the location set. Users can use the legend to change the data displayed in the sidebar by changing the;
- Year, Variable, Shaded by, or Isolated Ranges
Other unique features with the Table include;
- Mouseover a geography in the list will highlight the area on the map
- If there are both a data layer and data point loaded, use the drop-down menu to toggle between the layer or point data
- Select the headers in the Sort row to organized by name or rank by value.