New and Updated Features
![]() Updated
by
PolicyMap
Updated
by
PolicyMap
Feature | Details | Date |
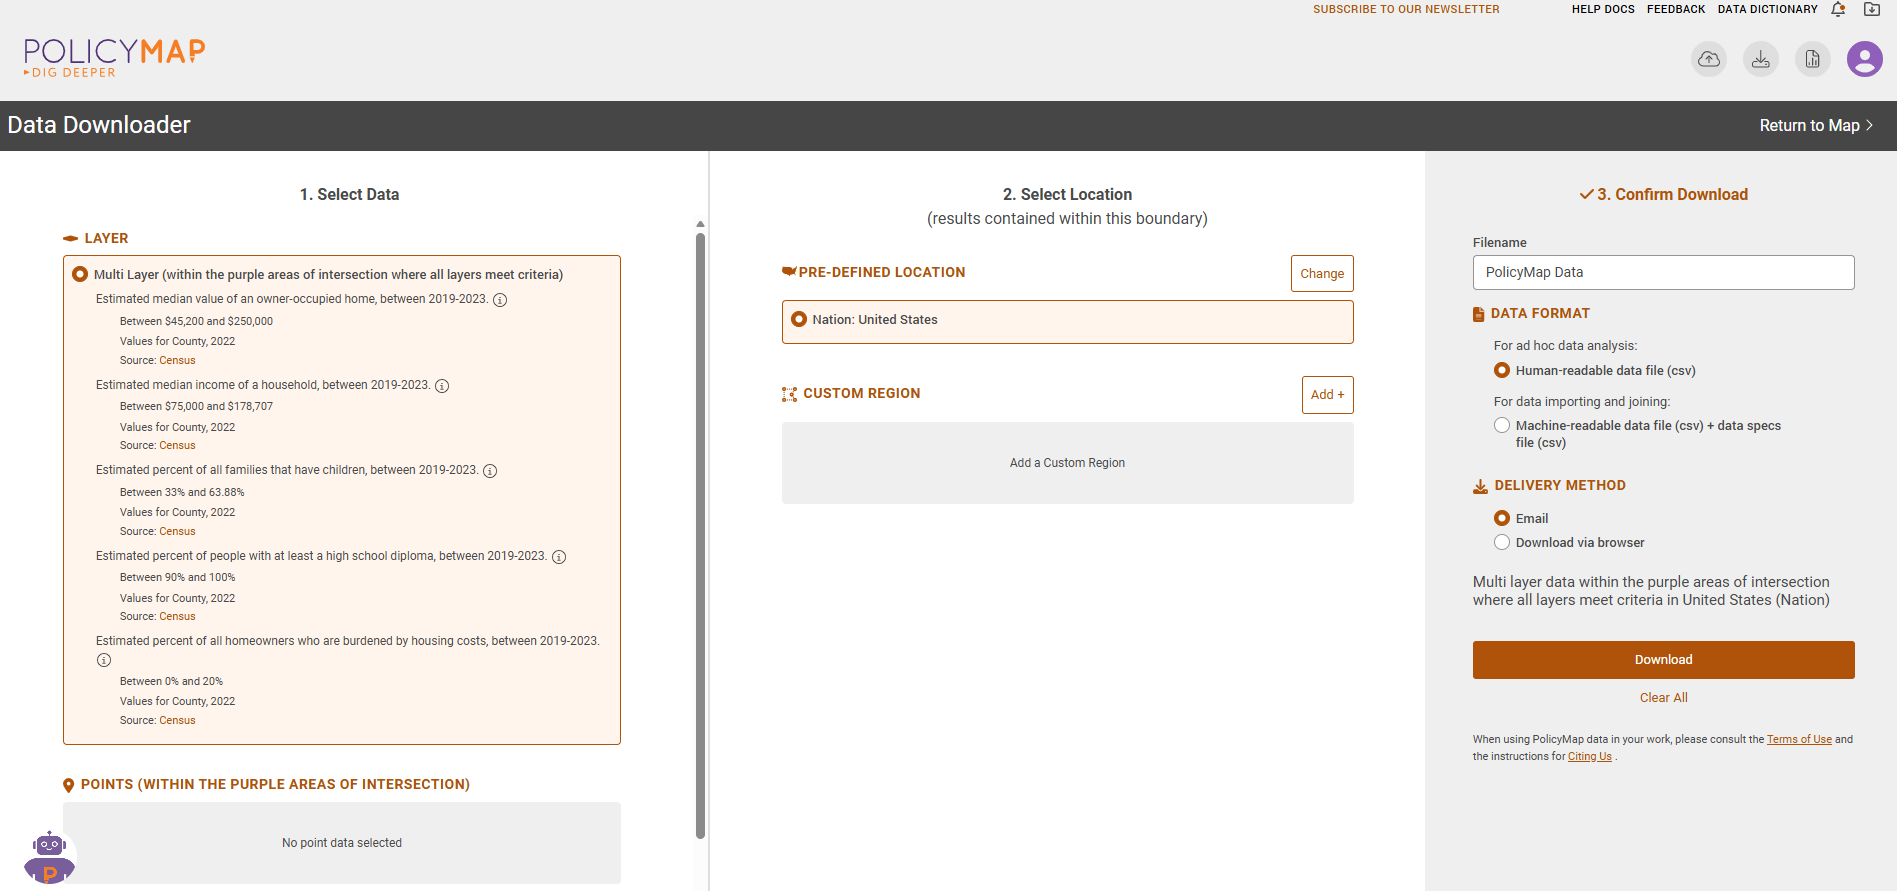 | Users can now download up to five layer datasets for an area at the same time. | Qtr1, 2026 |
 | Users can create filters for their uploaded point datasets when using the Data Loader. | Qtr4, 2024 |
 | Use the Annotation feature to add your own details to a map. | Qtr3, 2024 |
 | When clipping a location on the map, users can cover the background in white, creating an "island print" effect. | Qtr2, 2024 |
 | Collapse the legends for layer data, points data, and boundaries to save room on your map. | Qtr1, 2024 |
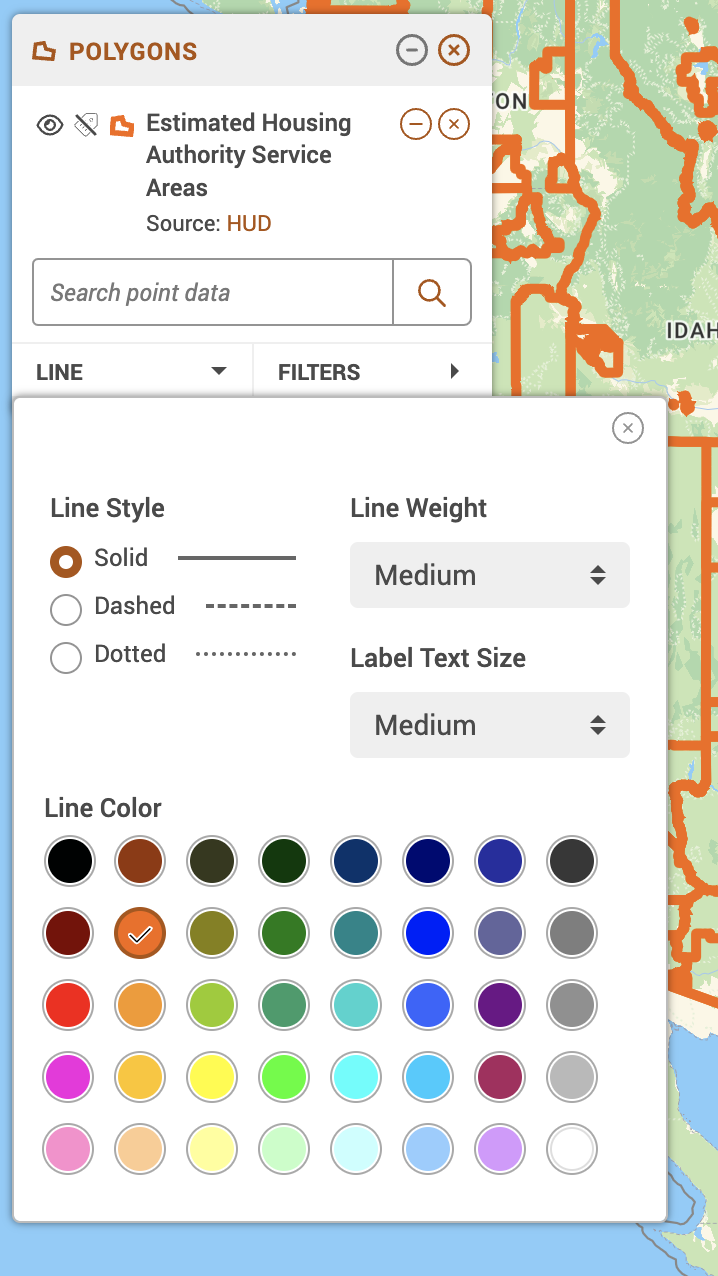 | Users can change the Line Style, Label Size, and Line Colors of polygon boundaries. | Qtr1, 2024 |
Custom Regions List is Paginated 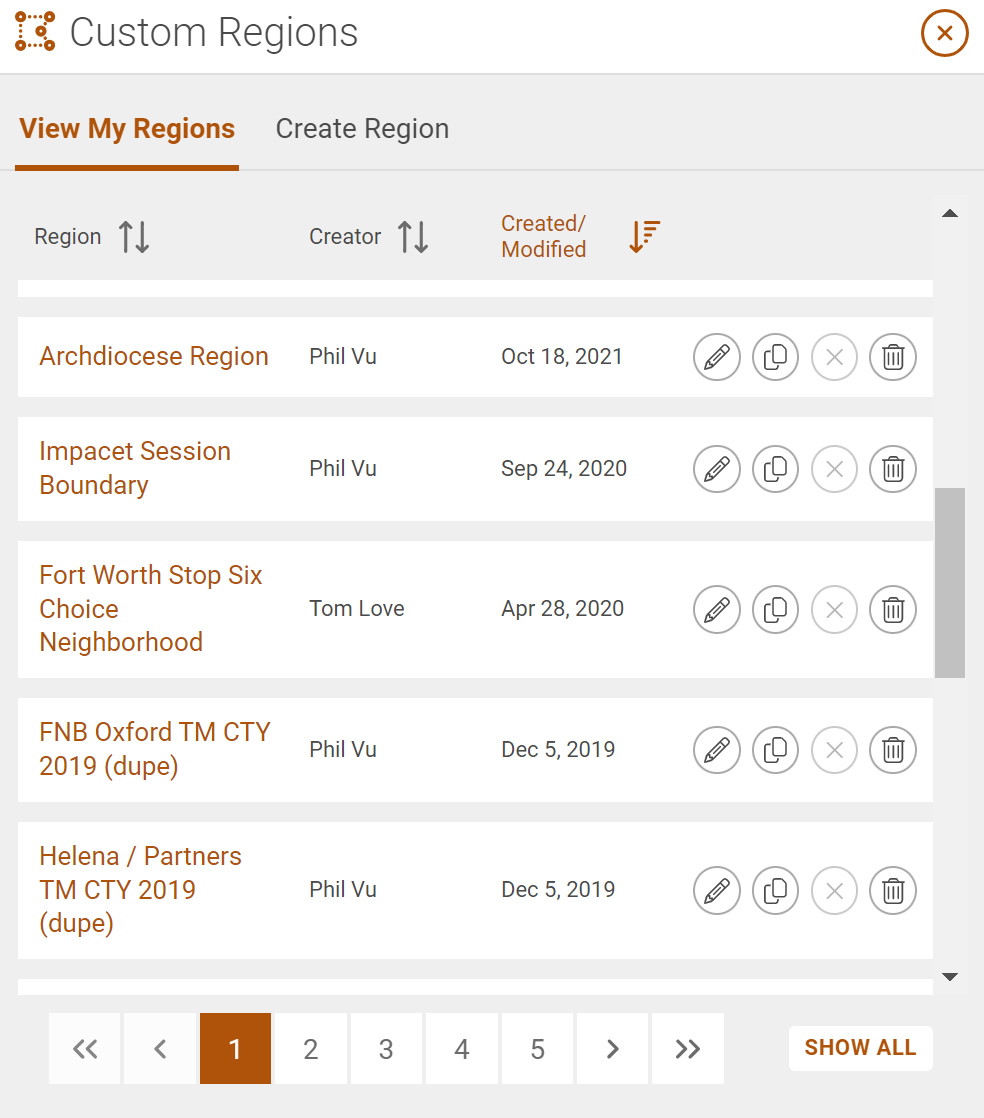 | Made Custom Region menu paginate to improve performance. | Qtr1, 2024 |
Better Print Adjustments | Added a feature to adjust the size of the legend and title in prints/exports. | Qtr1, 2024 |
New Citation Function 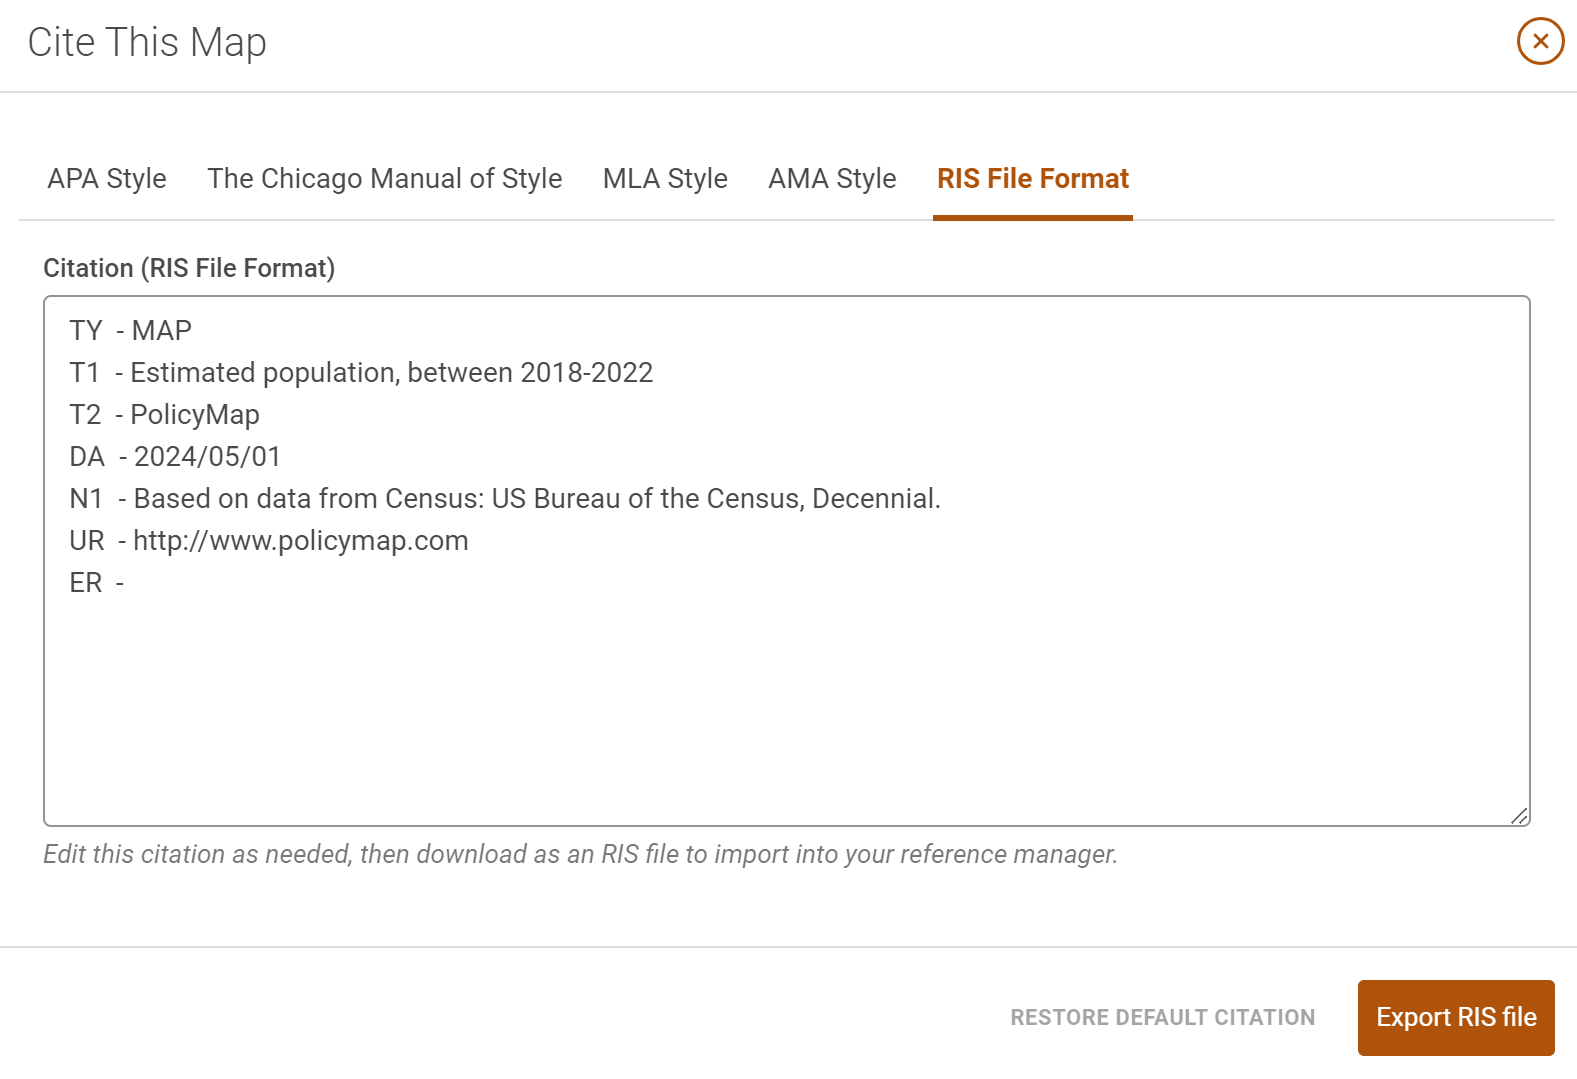 | Added new RIS citation format. | Qtr1, 2024 |
Better Print Quality | Improved resolution for prints/exports. | Qtr1, 2024 |
Flood Zone Download for Points with Layers | Enabled downloads of points combined with national flood data, to identify flood designations for specific lat/long. | Qtr1, 2024 |
Data Loader Improvement | Add Latitude and Longitudes in the data loader review page. This allows users who "hand geocode" addresses to add lat/long for addresses that failed the geocoder. | Qtr1, 2024 |
Dataset Suggestions in Data Search 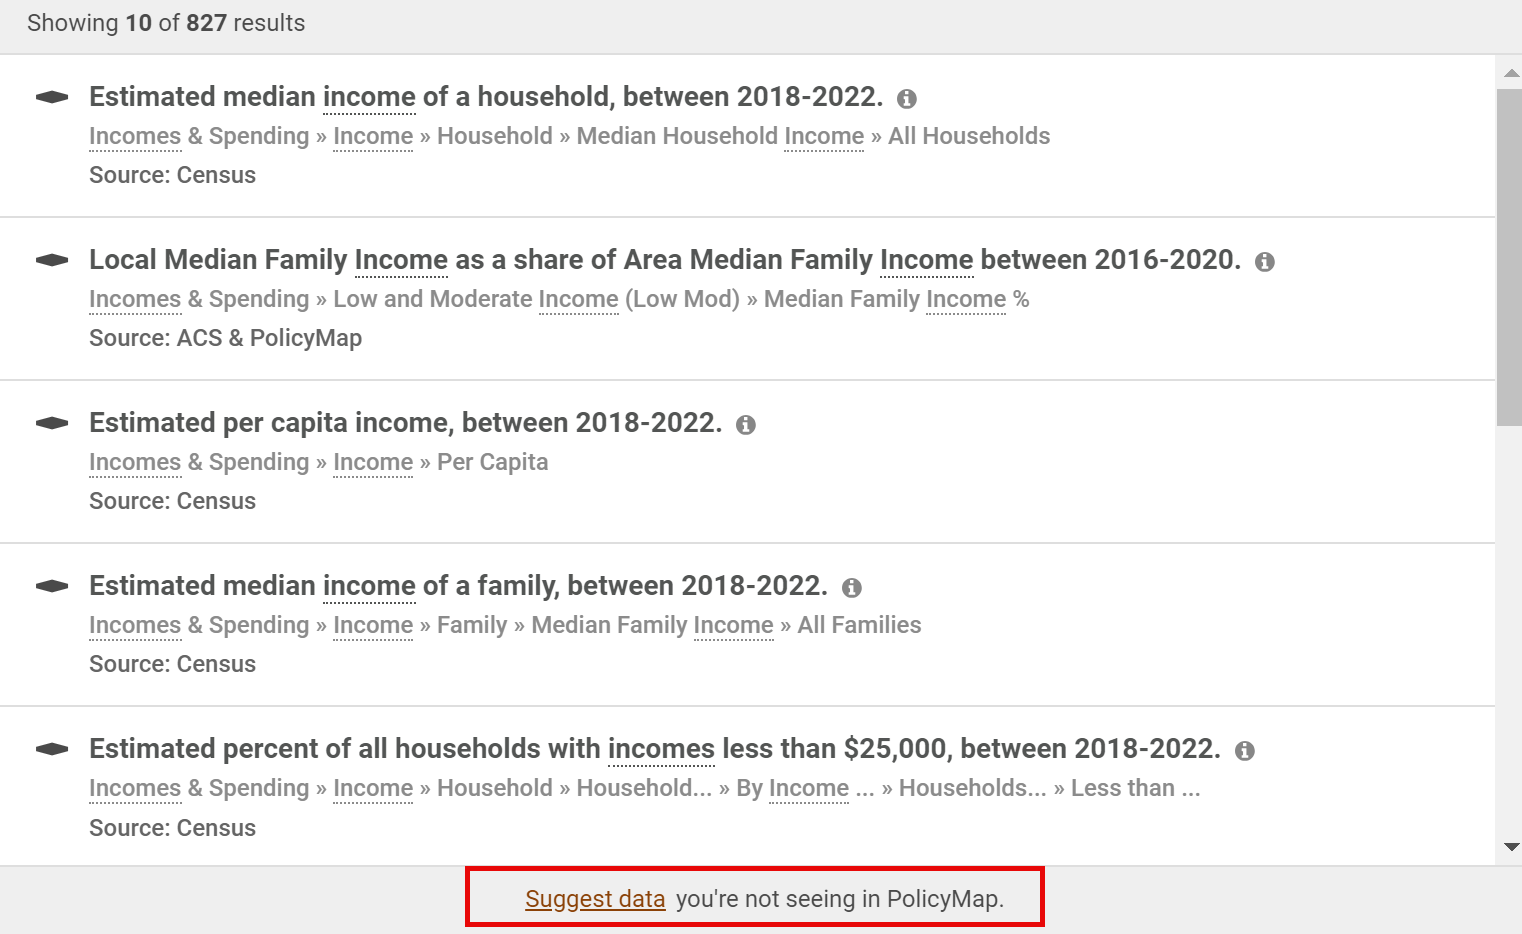 | Added ability for customers to suggest datasets they're not finding in PolicyMap. | Qtr1, 2024 |
Custom Color Ranges  | Users can create Custom Color Ranges for data layers. This option lets users create up to six (6) unique color ranges that can match their brand or project. | 2023 |
Map Extent  | The Map Extent feature allows users see how data layers ranges are represented locally. The default cut points for ranges are for the national range, so the map extent changes the data range for just the area they are viewing within the window. | 2022 |
Data Download Modal  | Premium subscribers can use the Data Download Modal to download for the US or any place in the country in file formats that can be used to build your own database or directly input data into another tool or software. | 2022 |
Print Download 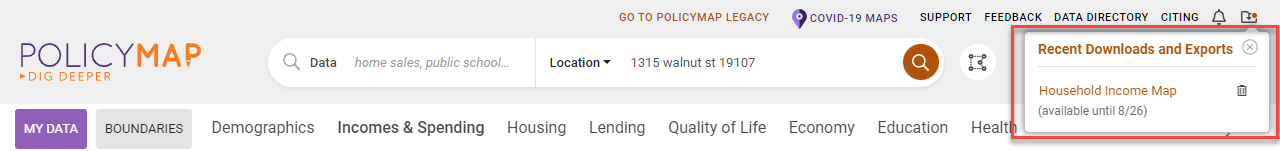 | Print downloads are saved in your sessions to download for up to 4 days. Use the | 2022 |
Data Loader 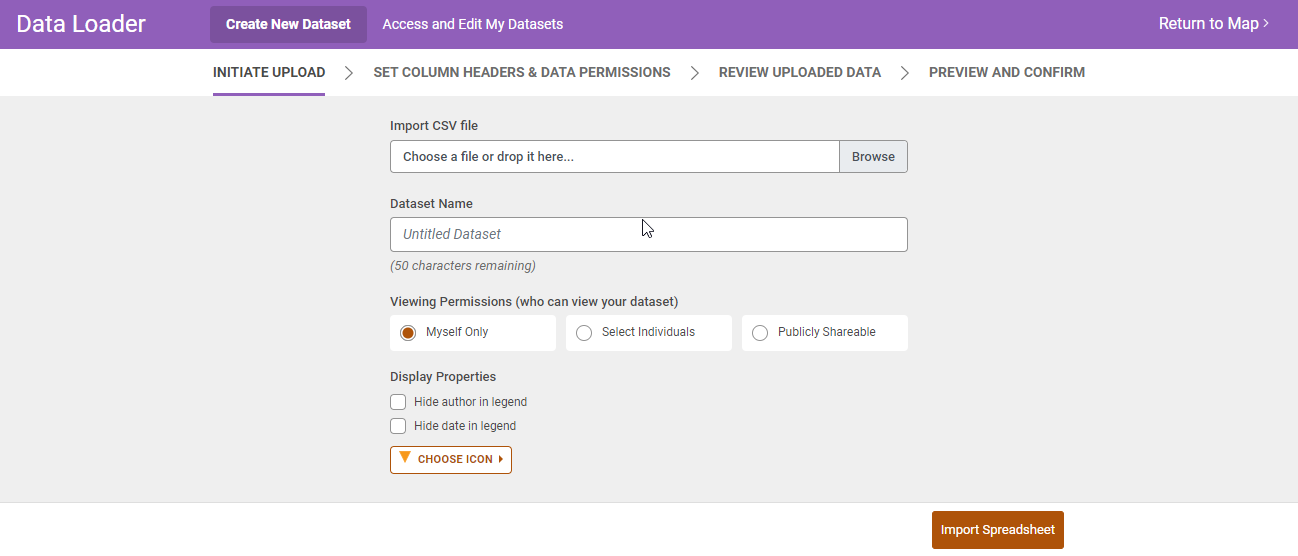 | The data loader allows users to load address-level data from a spreadsheet file to view in PolicyMap. Once loaded, users can use the dataset with other PolicyMap data and features. Learn how to use the Data Loader. | 2021 |
Clip Feature  | The Clip feature allows users to visually isolate data to a specified location. The map will only show data layers and data points for the clipped location. Use the clip feature in a printout/export also. | 2021 |
Sidebar Data Download  | The Data Download Sidebar allows all users to quickly download CSV formatted files for all public datasets directly from the map. | 2021 |
Sidebar  | The sidebar feature allows users to view data in a tabular format, view trend charts to compare years, and even download data for the location selected. | 2021 |
Isolate Ranges  | Ranges can be isolated and shown individually or with a group of ranges. Use the Layers legend to select the range or ranges to display. | 2020 |
Customized Base Maps  | Customize and even change the base maps using the Base Map Settings. Select the gear icon on the bottom right of the map to access the menu. From the menu, change the base maps and use a light, terrain, or even a satellite option. Each base option has it's own group of features and labels to add or remove. | 2020 |
Boundary Customizations  | The Boundaries legend allow users to add and remove labels, as well as customize the line type, line width, and color for each boundary. This option allows users to display multiple boundaries and show differences between each boundary. | 2020 |
Shaded By Lock 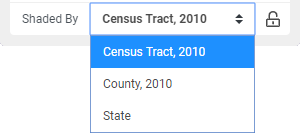 | The geography data is aggregated on the map is the "Shaded By" in the legend. As you zoom in or out, the geography of the shaded by might change to the county, zip code, census tract, and finally block group level. The | 2020 |
Points Legend Customizations  | The points legend lets any points dataset be customized with the option to change the icon size, shape, and color. This allows users to display multiple points dataset and give each datasets its own look. The points search allows user to find any address in the extent of the map that matches the text entered. The points search can also be used to isolate any points that contain the text entered. | 2020 |
Multi-Layers OR Function | Users can select the OR function in the legend to change the query for the data layers to the "overlay". This will over the overlap of data layers. The OR function introduces colors and patterns to show how 1, 2, or more data layers might over lap. The OR function can show more information about the surrounding area of the places that met the AND function. | 2020 |
Edit Custom Regions  | Custom regions can be edited to change the area, shape, or coverage. For assembled custom regions, users can add and remove places; for radius regions, users can adjust the radius or move the centroid, and for drawn custom regions users can move the boundaries. Use the custom region info bubble and select Edit Shape to begin editing. | 2020 |
Multi-Layer Maps  | The Multi-Layer Maps tool allows users to overlay up to 5 data layers, create custom ranges for each in the legend, and the map will show only places that meet the criteria set. This gives users the ability to quickly find places that meet set criteria. | 2020 |
 to manage downloads saved in the sessions. Users can re-download or delete saved downloads.
 icon will lock the Shaded By, allowing users to zoom in and out without the data recalculating for different geographies.