Multi-Layer Data Download
![]() Updated
by
PolicyMap
Updated
by
PolicyMap
Downloading data in Multi-Layer Maps is very similar to downloading data on a single layer, but allows downloading multiple data layers and even point datasets at the same time.
Users should have an understanding of the Multi-Layer Map tool for this guide. Check out our guide here or attend our weekly trainings. Because there are thousands of combinations of data layers, geographies, and data points, we will give a variety of examples of data download types.
The query function of the Multi-Layer Map tool will determine the type of files you will download. In our examples, we will share both download samples and explain each file.
- A Multi-Layer Map using the AND function will receive a single data file containing all geographies that meet the legend criteria.
- A Multi-Layer Map using the OR function will receive a data file for EACH data layer in the legend, but will only show the geographies that match the legend.
Example 1: Basic Multi-Layer Map with two data layers.
Let's start with the basics of downloading data from the Multi-Layer Map, and we can begin with the simplest example: two data layers with the same Shaded By (geography). In this example, we have created a multi-layer map of zip codes in Pennsylvania with at least 20% of households that do not have cars, AND no more than 33% of households are single-headed parents with children.
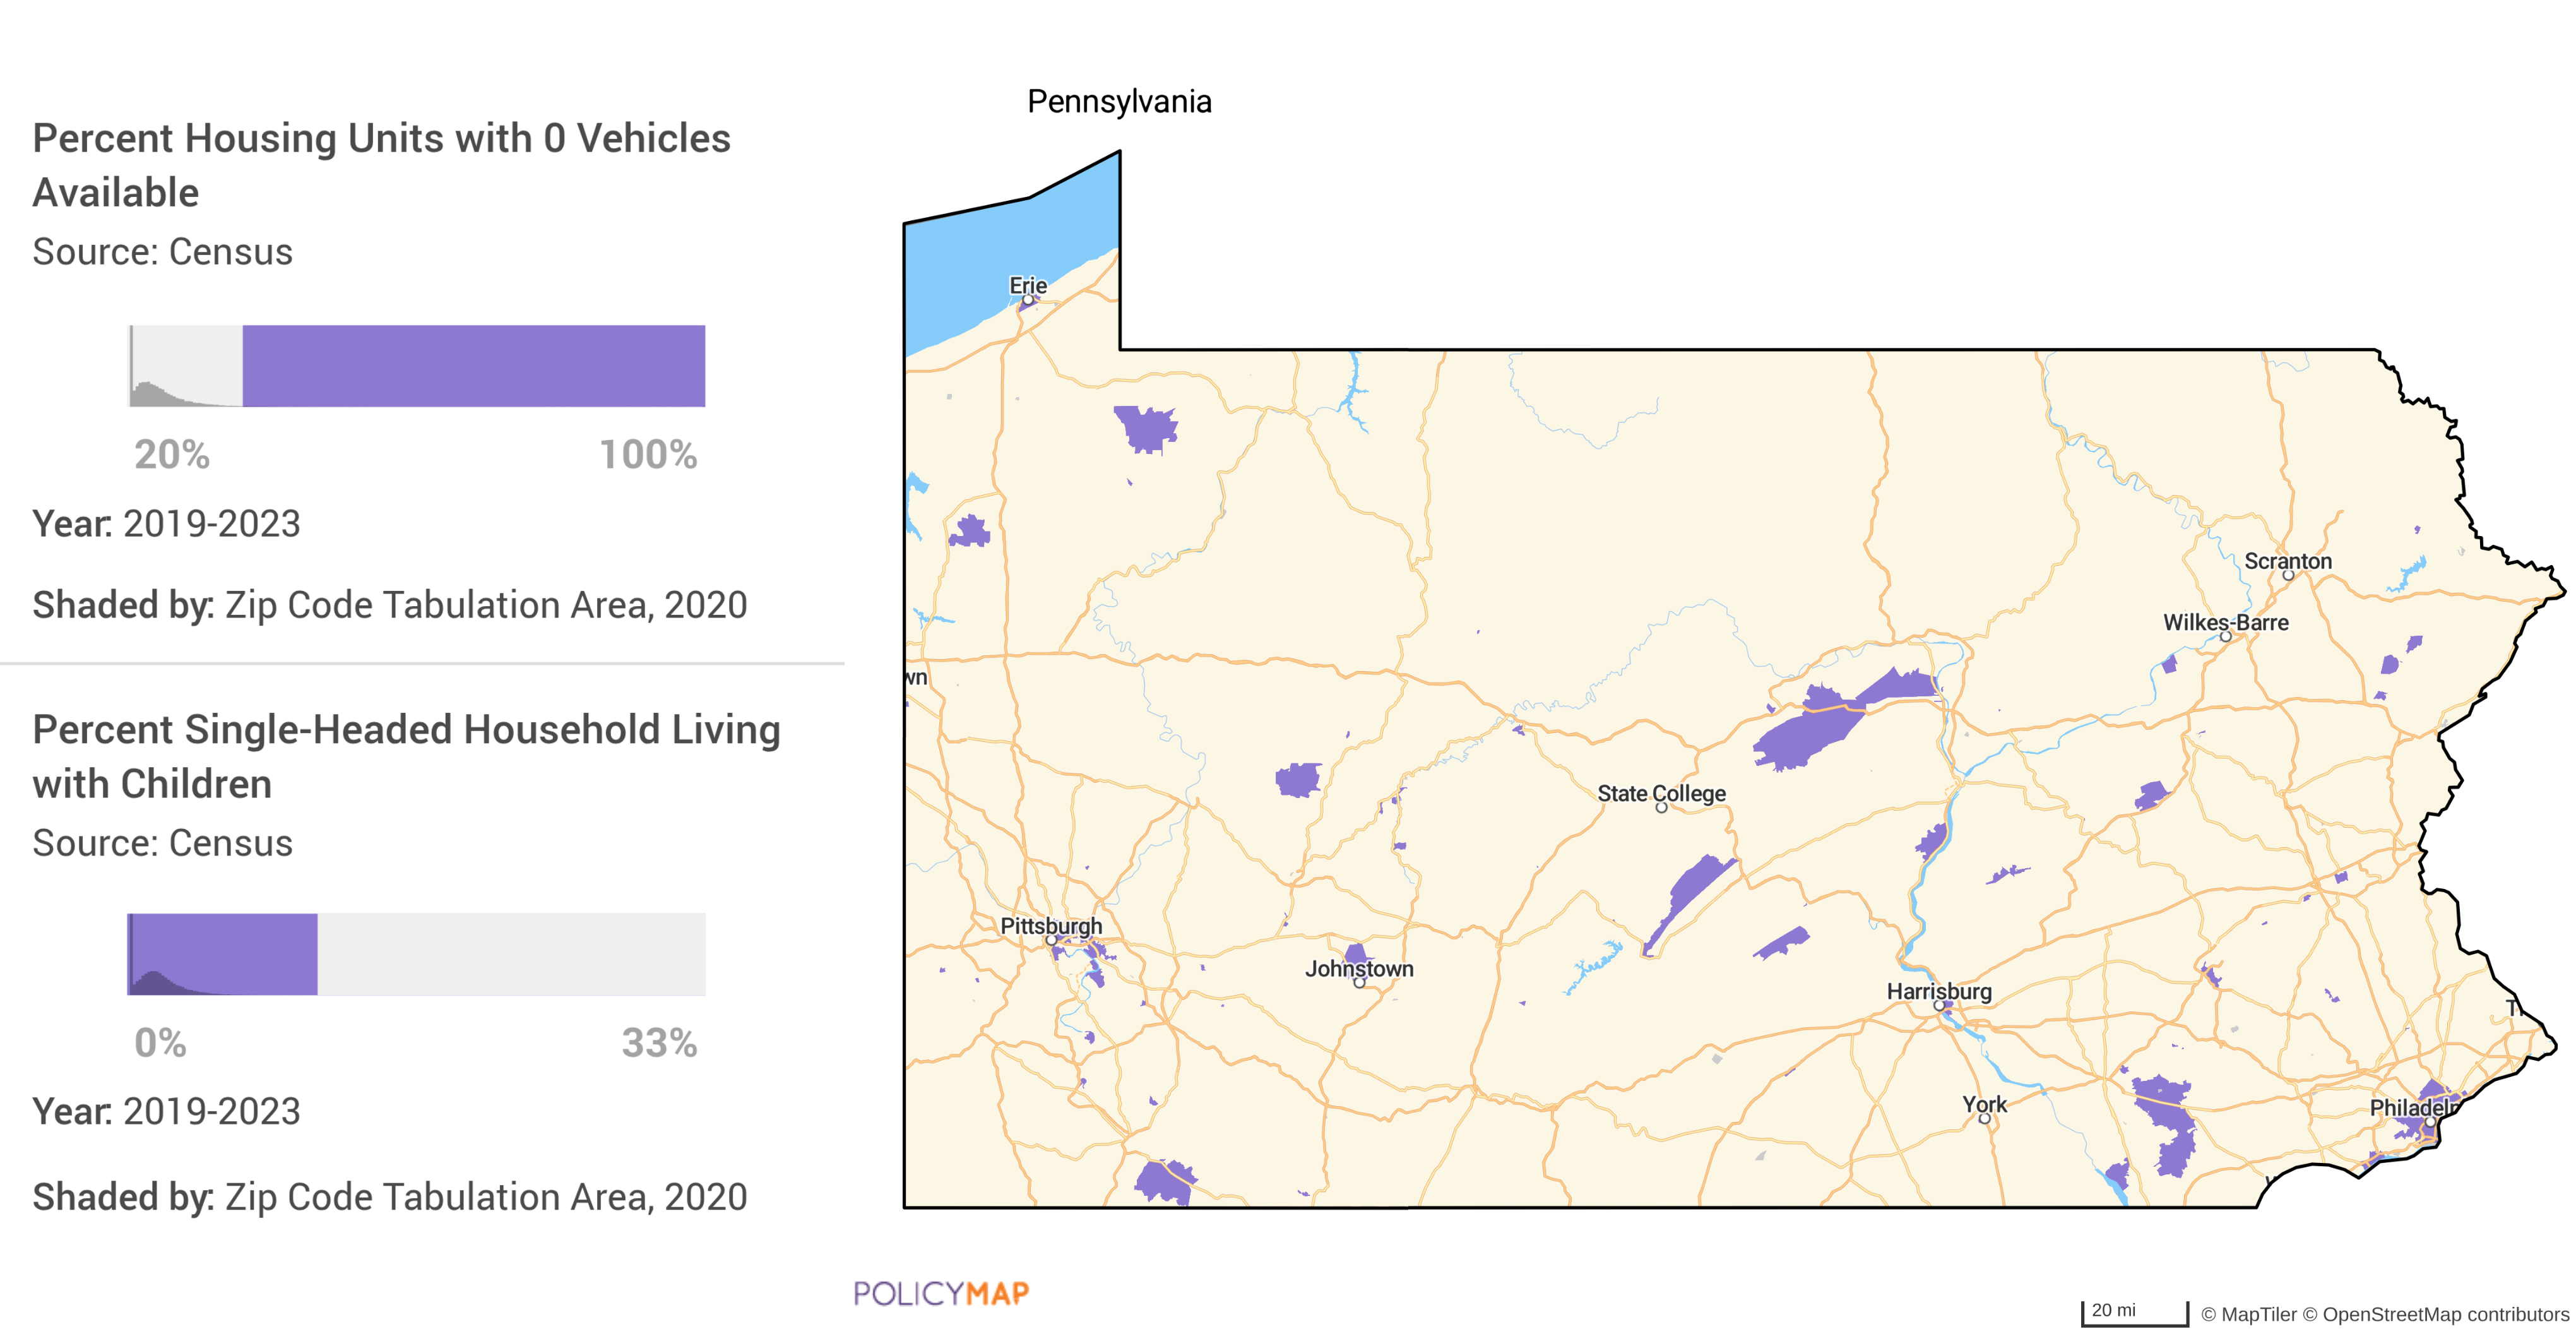
When we download the intersection of these two data layers (using the AND function), we will get a table listing all zip codes that meet both criteria. Here is the example file.
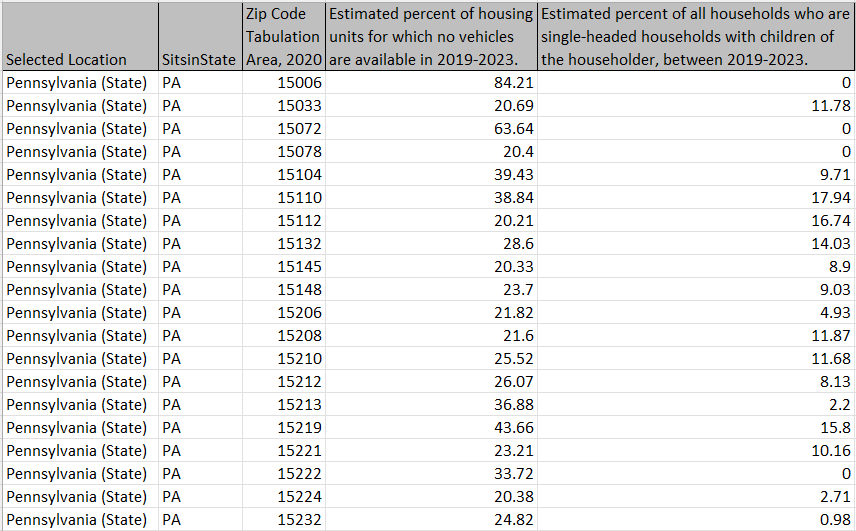
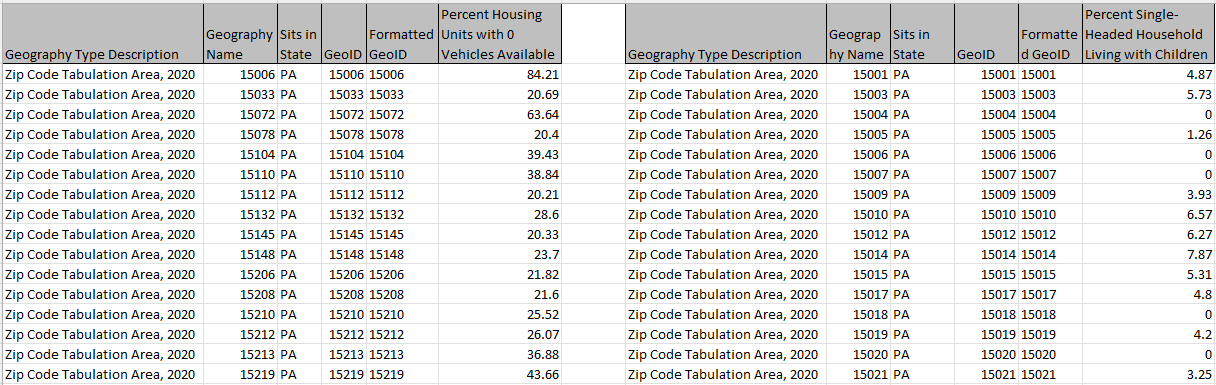
And if we download the overlap of these two data layers (using the OR function), we will get two separate files for each data layer, but only the zip codes that meet the criteria set in the legend. The image combines the two files; Car Ownership Households and Single-Parent Households.
Example 2: More than 2 data layers and the same Shaded By (geography).
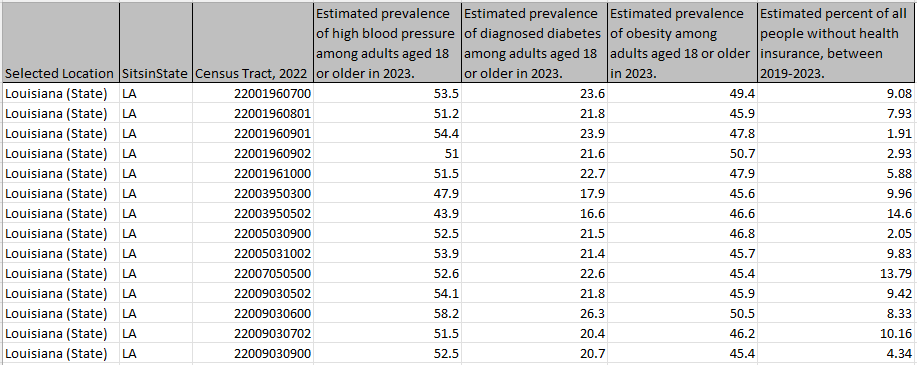
Let's increase the number of data layers but keep the same Shaded By (geography). Here we have a Multi-Layer Map of Louisiana showing Census tracts with; at least 40% of adults with High Blood Pressure, at least 15% of adults with Diabetes, at least 45% of adults who are Obese, and no more than 25% of the persons there are without health insurance.
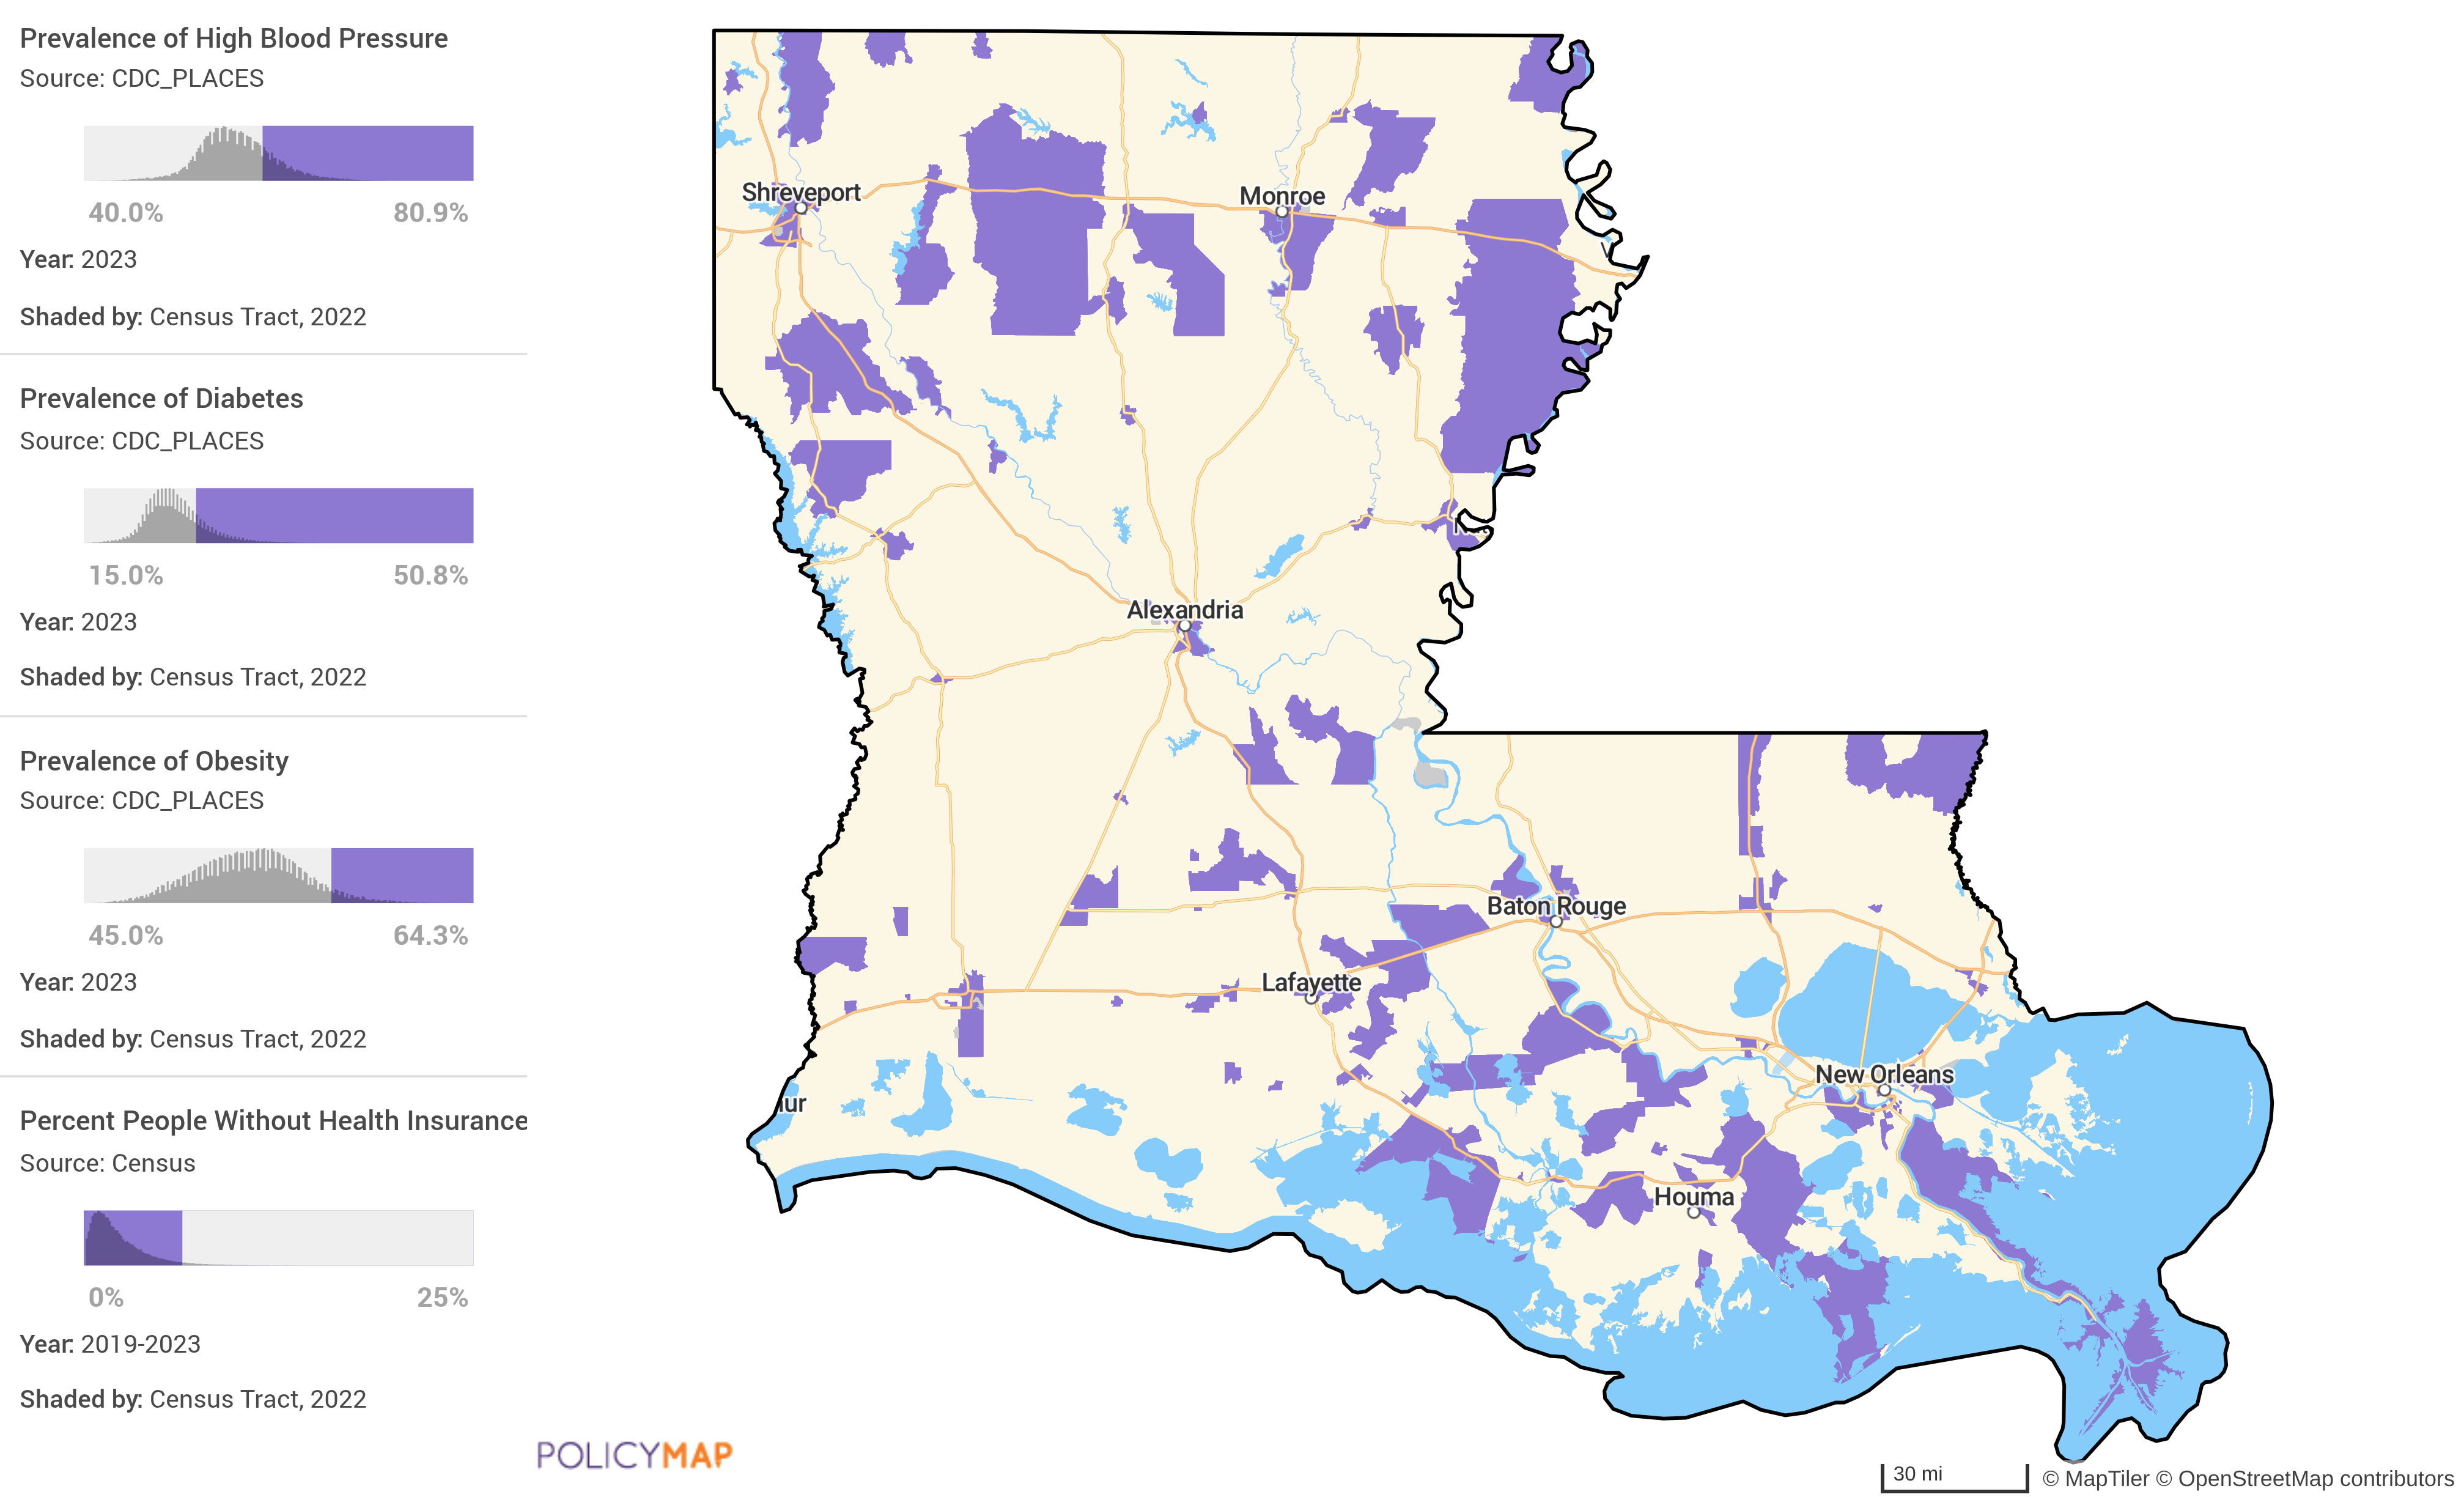
When we download the intersection of these 4 data layers (using the AND function), we get a table showing the Census Tracts and data for all 4 layers. Here is the example file.
If we download the overlap of the 4 data layers (using the OR function), we get 4 separate files that have data for all the census tracts that match our criteria: Adults with High Blood Pressure, Adults with Diabetes, Adults who are Obese, and Persons without Health Insurance.
Example 3: Using different geographies (Shaded By)
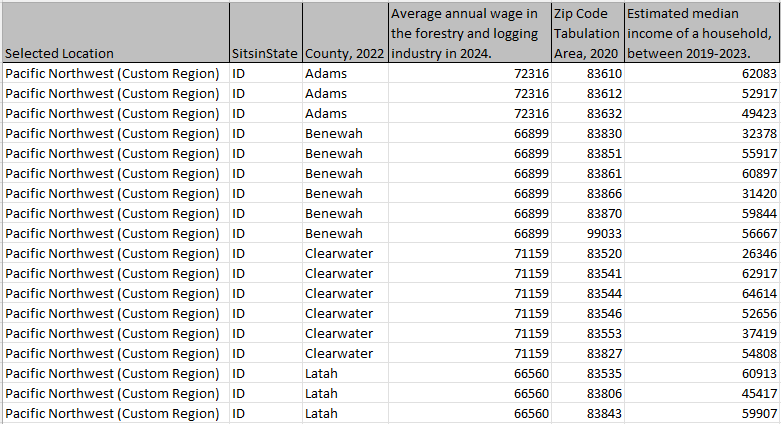
If we use different Shaded By geographies in the legend, the Multi-Layer Maps download will show the "nesting" of geographies. This is when a query uses geographies of different sizes or years. In this example, we are looking to see if wages in the Forestry and Logging industry match the local household income. We can then show the intersection of Counties with the Average Wage in Forestry and Logging, starting at $65,000, compared to Zip Codes with the Median Housing Income of no more than $65,000.
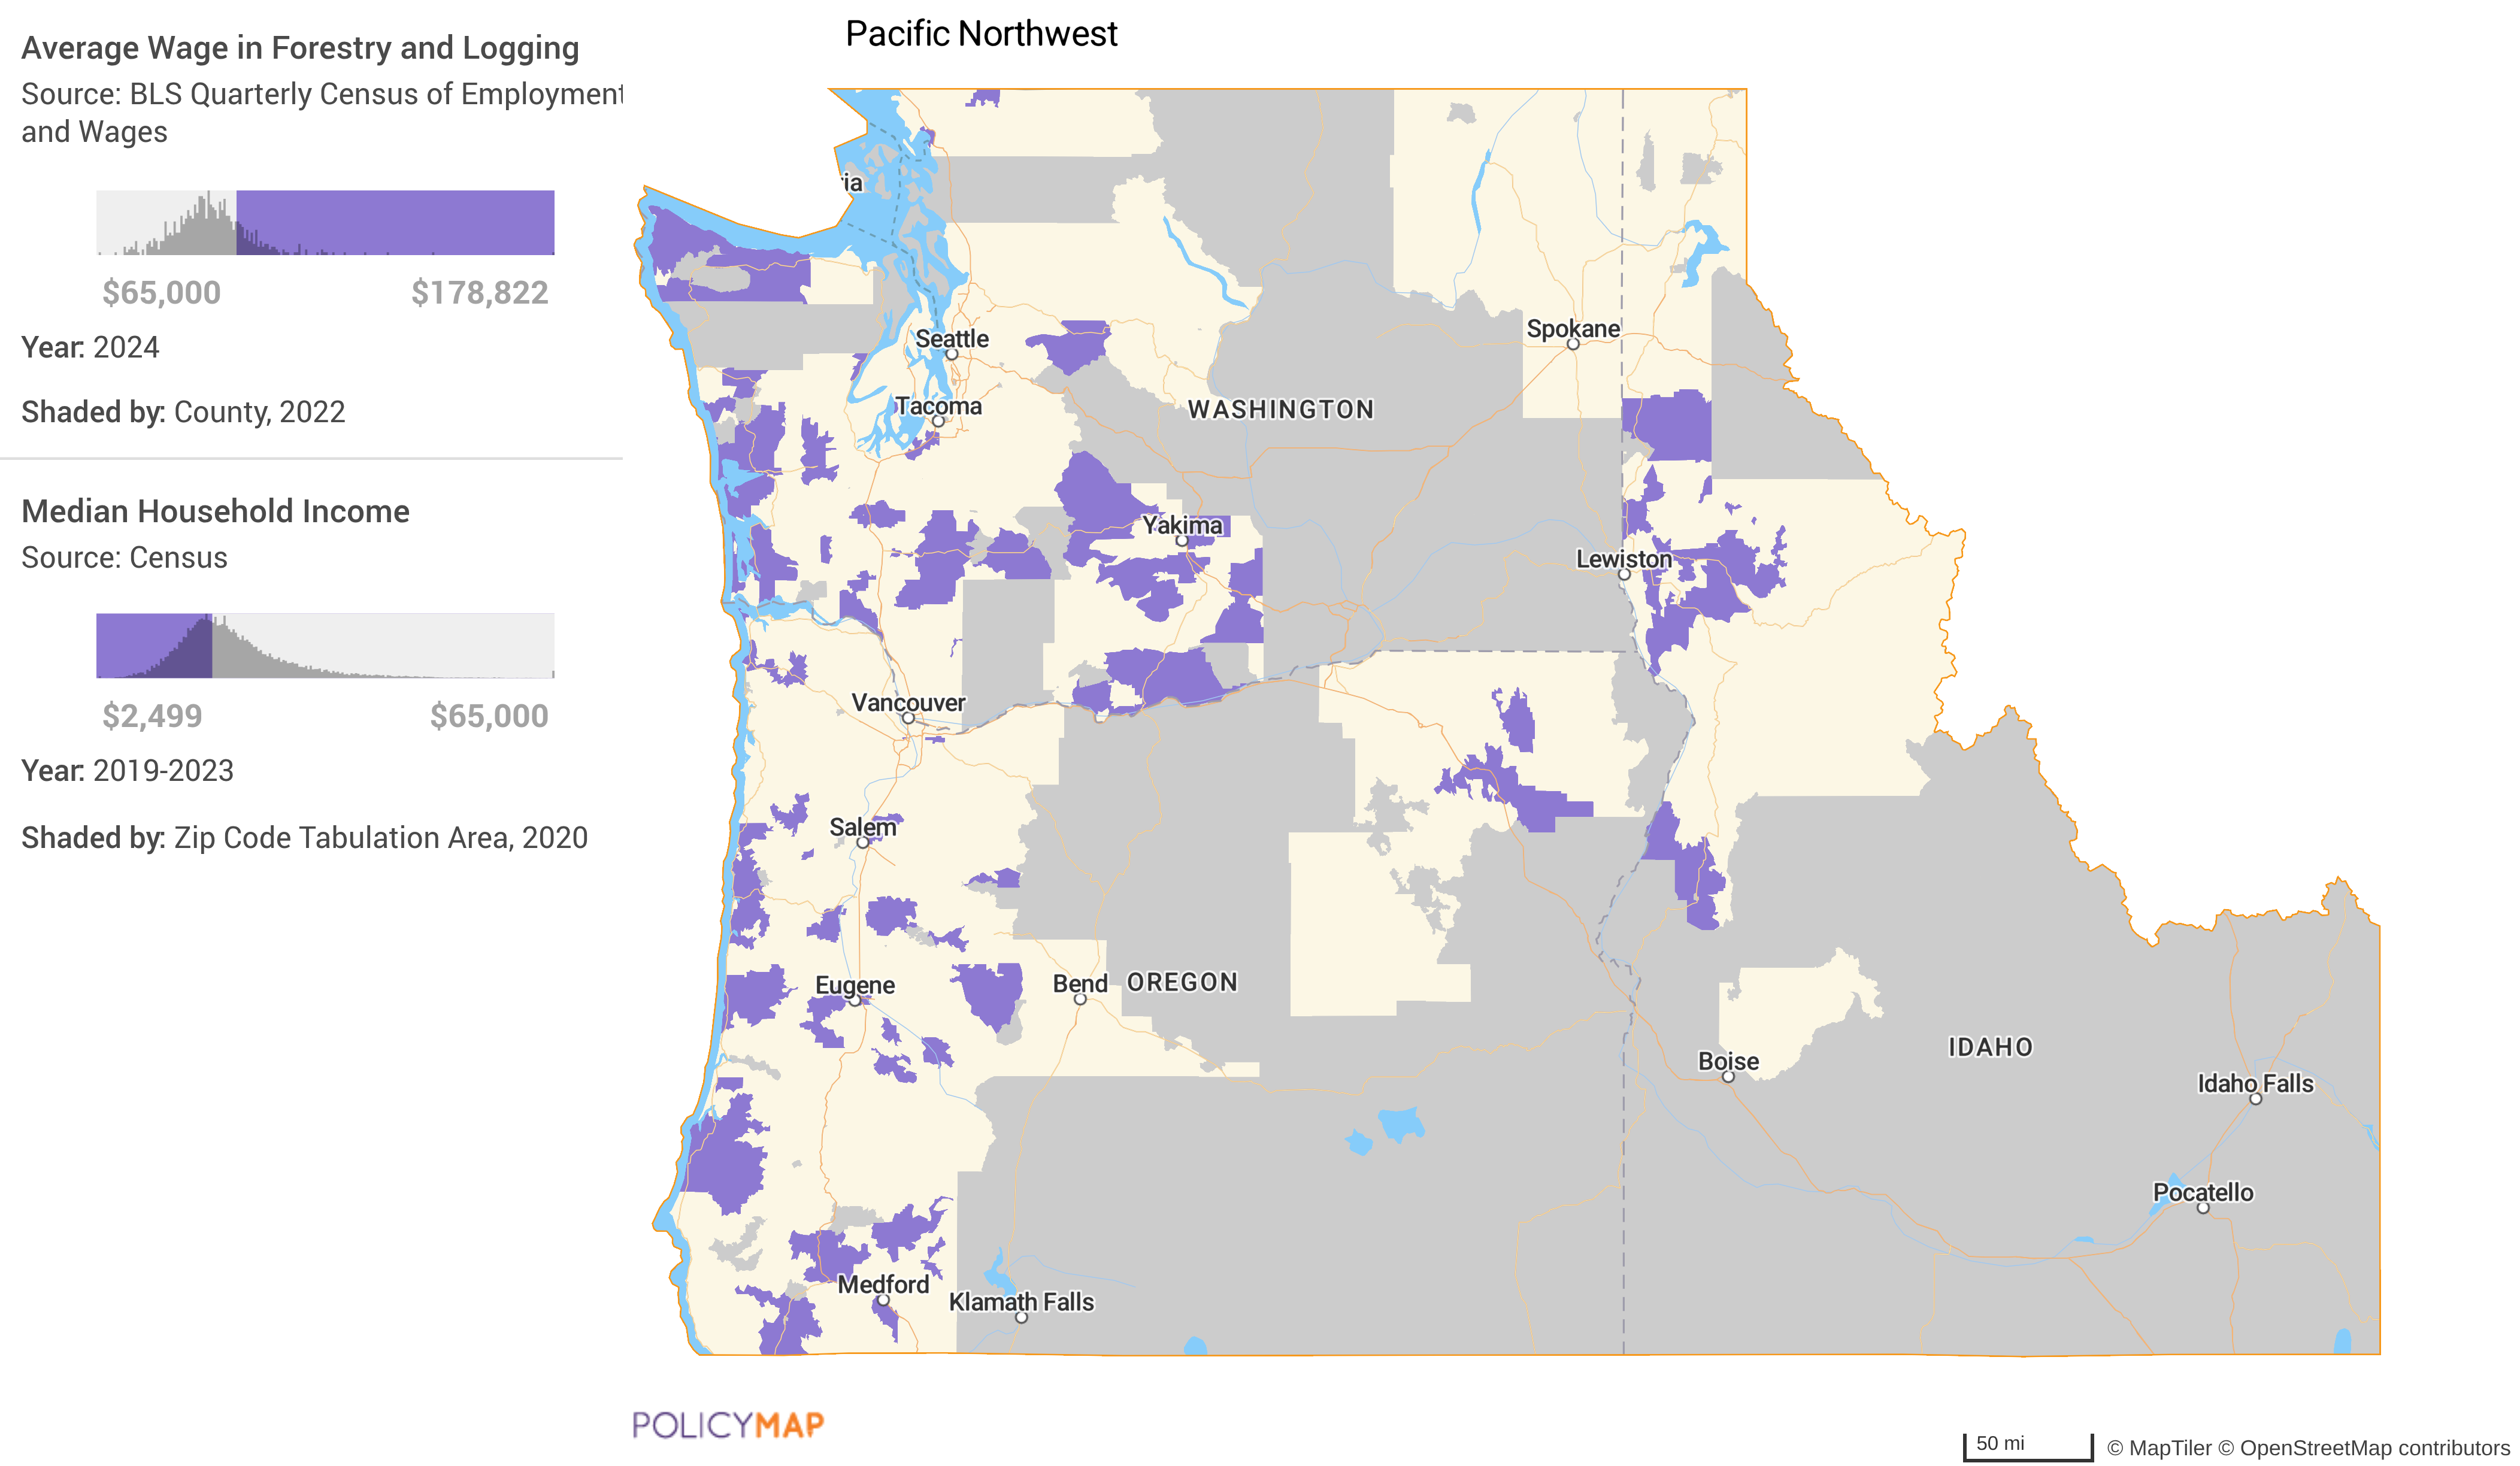
In this example, the AND function download shows which zip codes matched our criteria in the legend, and the counties that also matched are shown on the map. You can see that zip codes 83610, 83612, and 83632 are in Adams Co. Here is the full list of zip codes and counties.
Example 4: Finding geographies within larger geographies
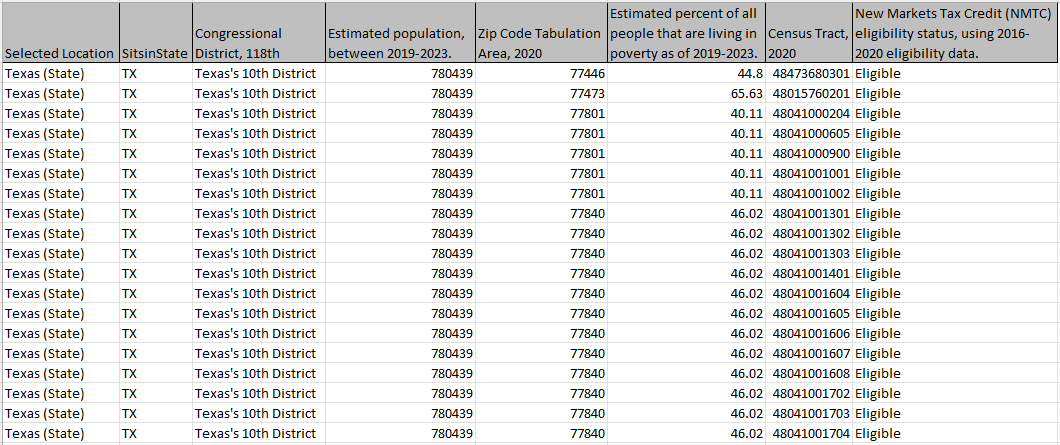
We can use the "nesting of geographies" in example 3 to find a grouping of geographies that sit within larger geographies. In this example, we are looking for Census tracts that qualify for the New Markets Tax Credit program, AND are within Zip Codes with a poverty rate of at least 30%, AND within Congressional Districts with a population of less than 1.5 million people.
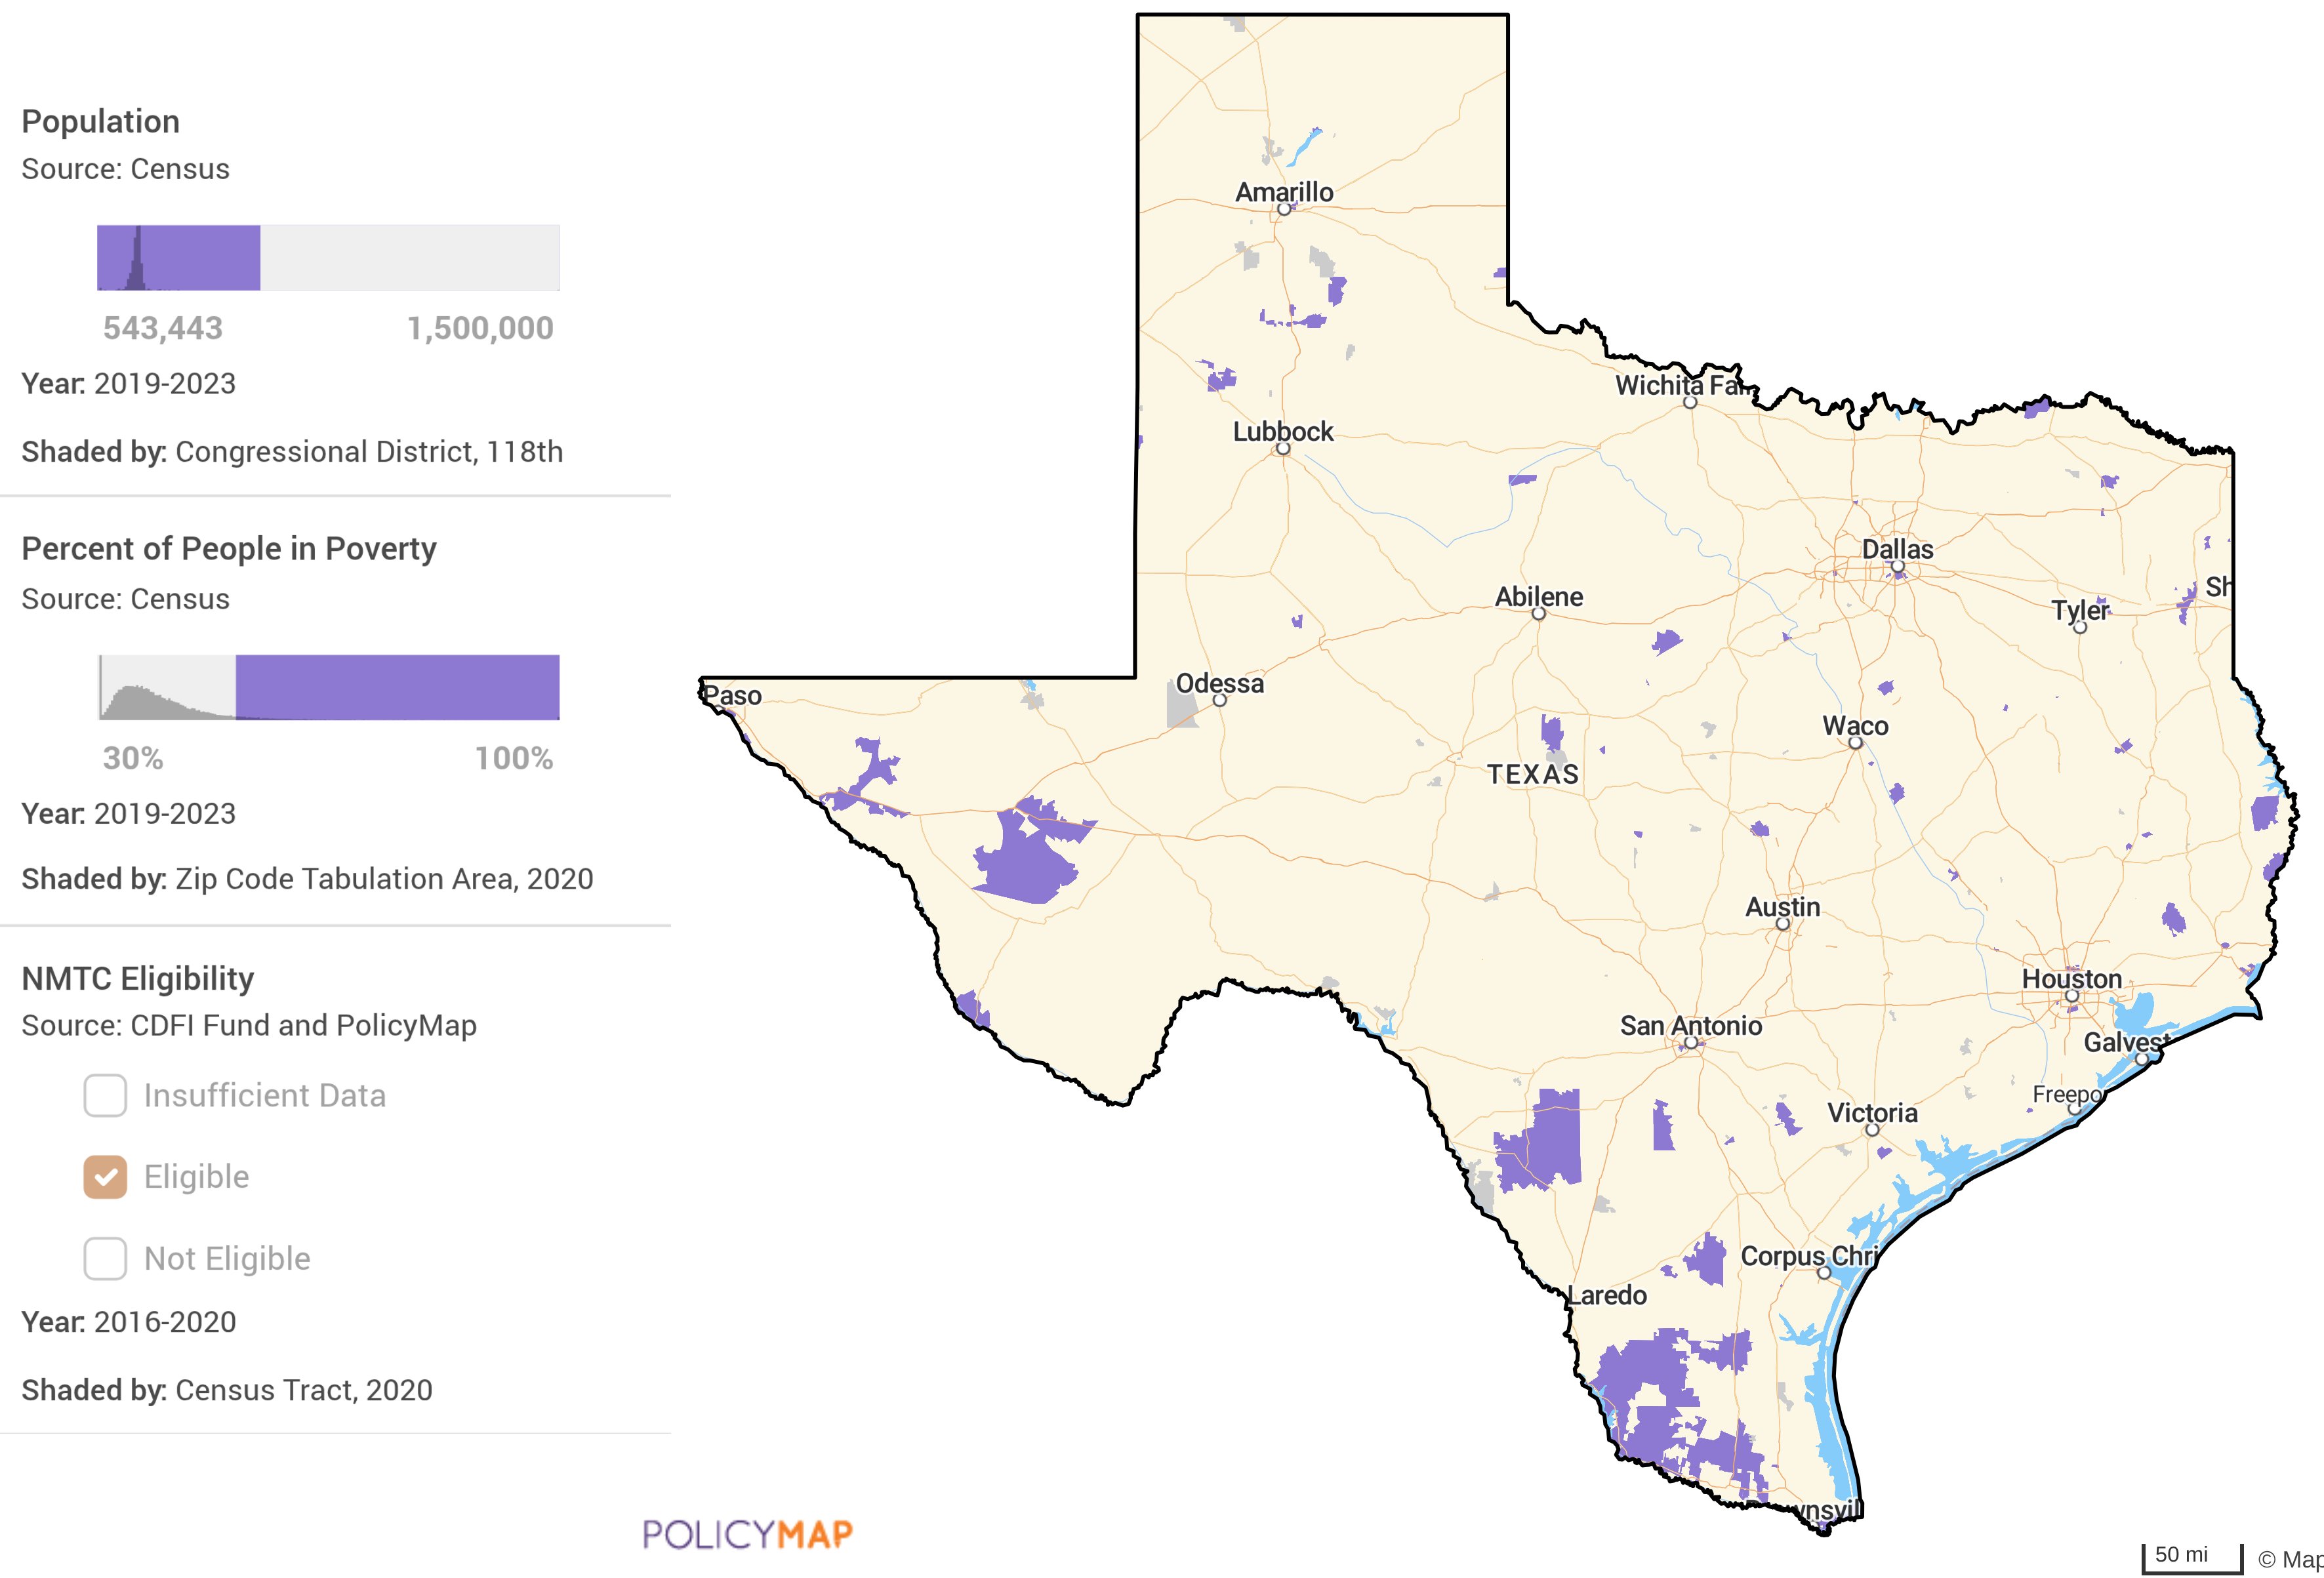
When we download the intersection (using the AND function) of these 3 data layers, we get a list of Congressional Districts, the zip codes that sit within those districts, and then a list of Census Tracts that sit within the zip codes. Here is the full example file. In the table below (and in the full file);
- We see Texas's 10th Congressional District, with a population of 78,043.
- The percentage of people in poverty for Zip Codes 77446 is 44.8%, 77473 is 65.36%, 77801 is 40.11%, and 77840 is 46.02%. All sit within the 10th Congressional District.
- Finally, we see a list of Census tracts eligible for the New Markets Tax Credit program, along with the zip code they are in.
- Tract 48473680301 sits within Zip Code 77446.
- Tract 48015760201 sits within Zip Code 77473.
- Tracts 48041000204, 480410000605, 48041000900, 48041001001, and 480410001002 sit within Zip Code 77801.
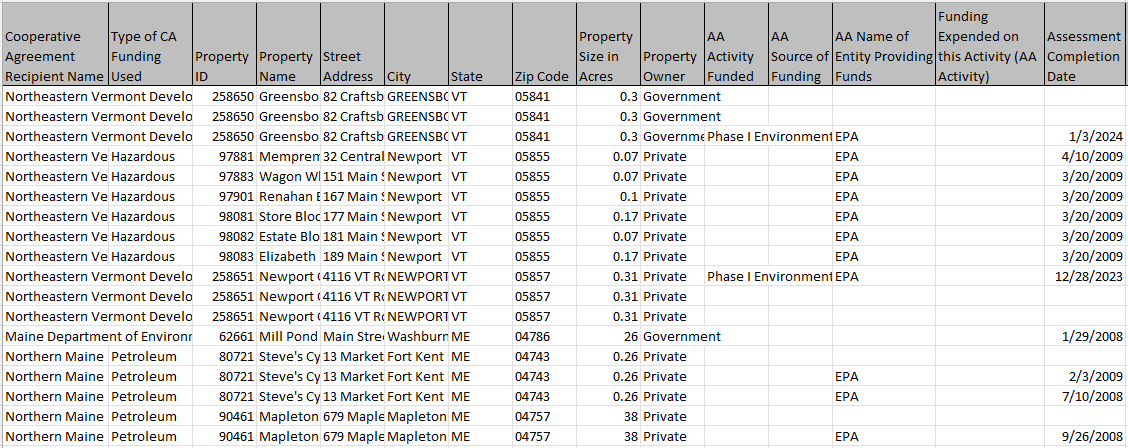
Example 5: Data Points in a Multi-Layer Map
In our last example, we will download a point dataset (address-level data) that falls within a Multi-Layer Map. Here is a map of the New England region with Brownfield locations that do not require cleanup, in counties that are Qualified HUBZones, AND at least 45% of Small Business Loans with business revenue of less than $1 Million Dollars.
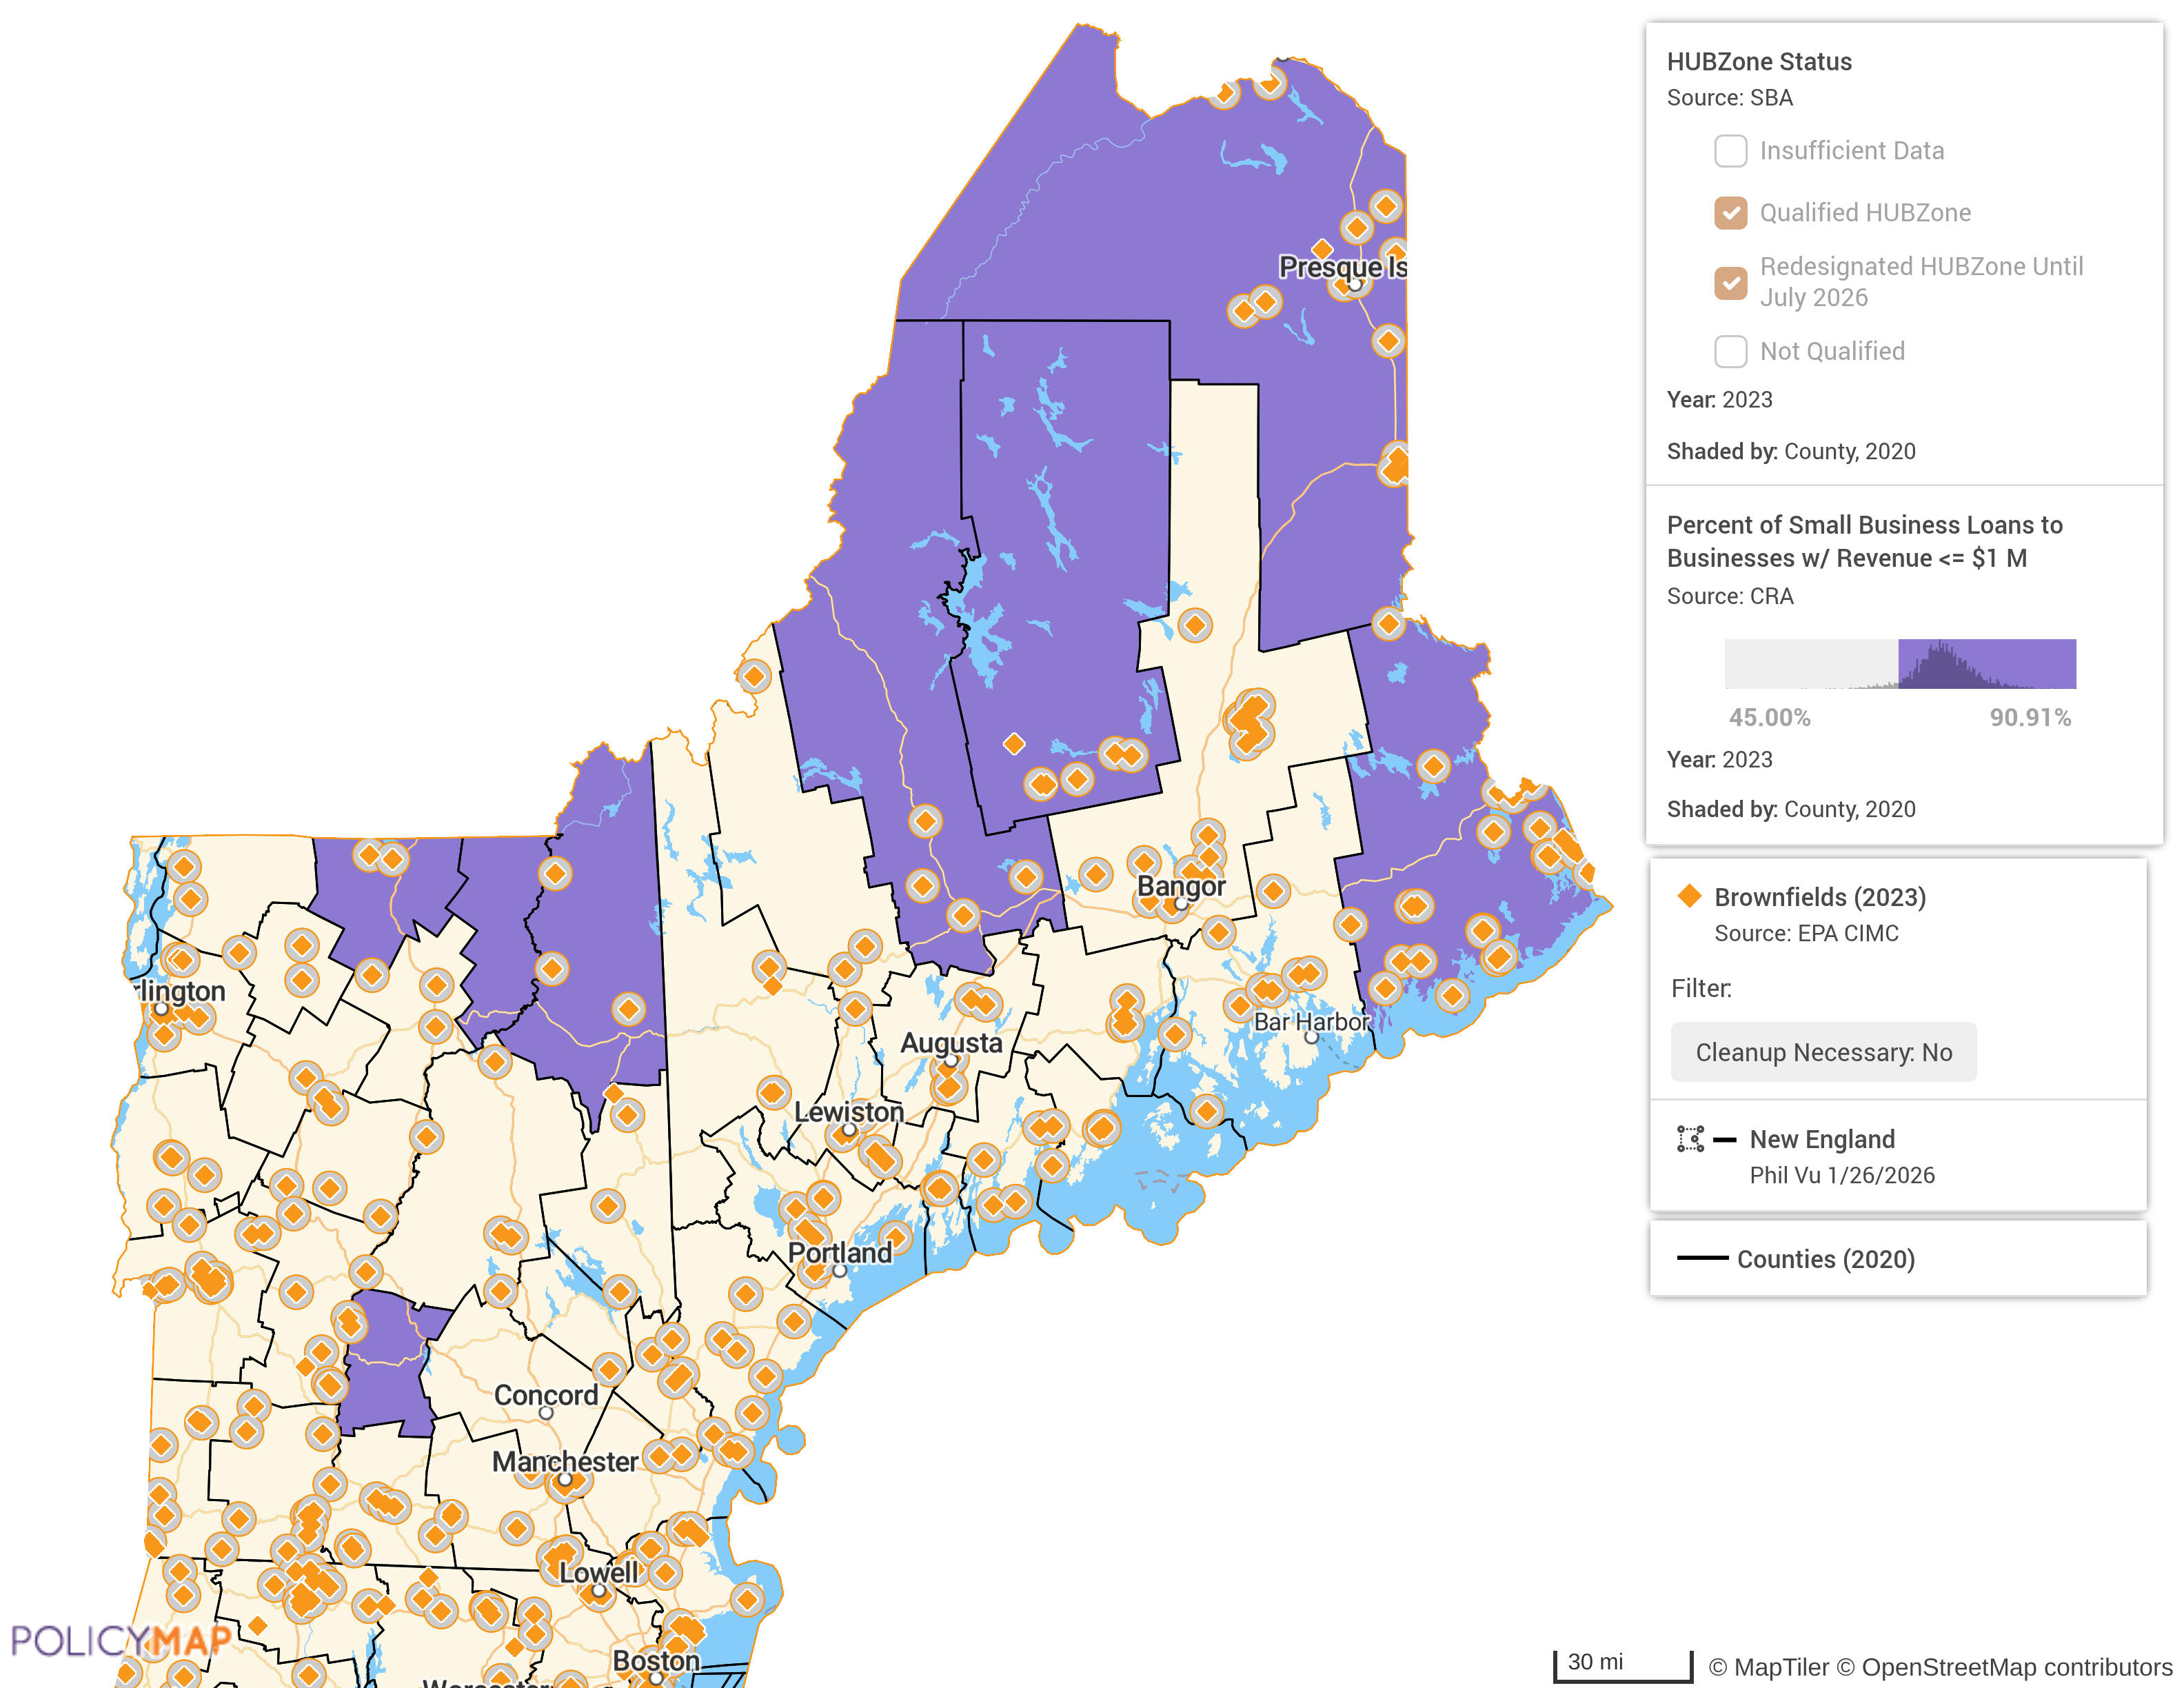
Because point dataset downloads on a Multi-Layer Map are for the intersection (the AND function), the downloaded file will show only point dataset data, and none of the data layer data. Here is the example file.
There are over 80,000 data layers and millions of addresses on PolicyMap, so the combinations used in a Multi-Layer Map are endless. We hope these examples can show users some of the unique ways to use the Multi-Layer Map tool and the countless combination of data layers and point data available.
For any help in using the tool, please contact our Customer Engagement Team at support@policymap.com