Making a Multi-Layer Map
![]() Updated
by
PolicyMap
Updated
by
PolicyMap
Use the data menus or data search field to add a data layer to the map. Multi-Layer Maps is a neighborhood search tool allowing you to find places that match up to five data layers on the map.
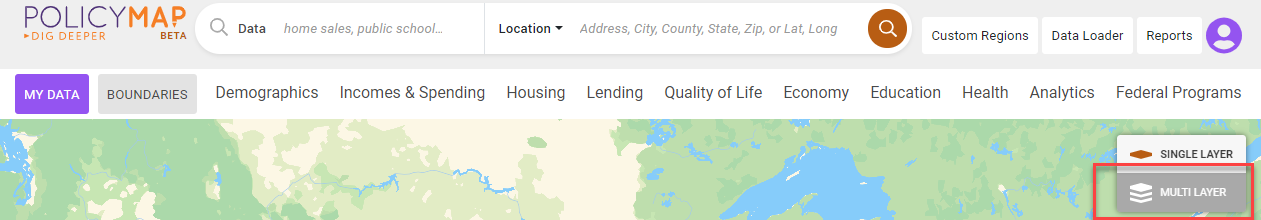
- To start, select Multi-Layer Maps from the upper-right corner of the Maps page.
The page will look similar to the Maps page, with the location search bar and data menus above the map. The color scheme for the data menu will change to purple.
Enter a location
If you are not zoomed into a neighborhood level, you will see a message suggesting users to zoom closer. Use the Location Search bar to zoom into an address or location on the map

Add a data layer
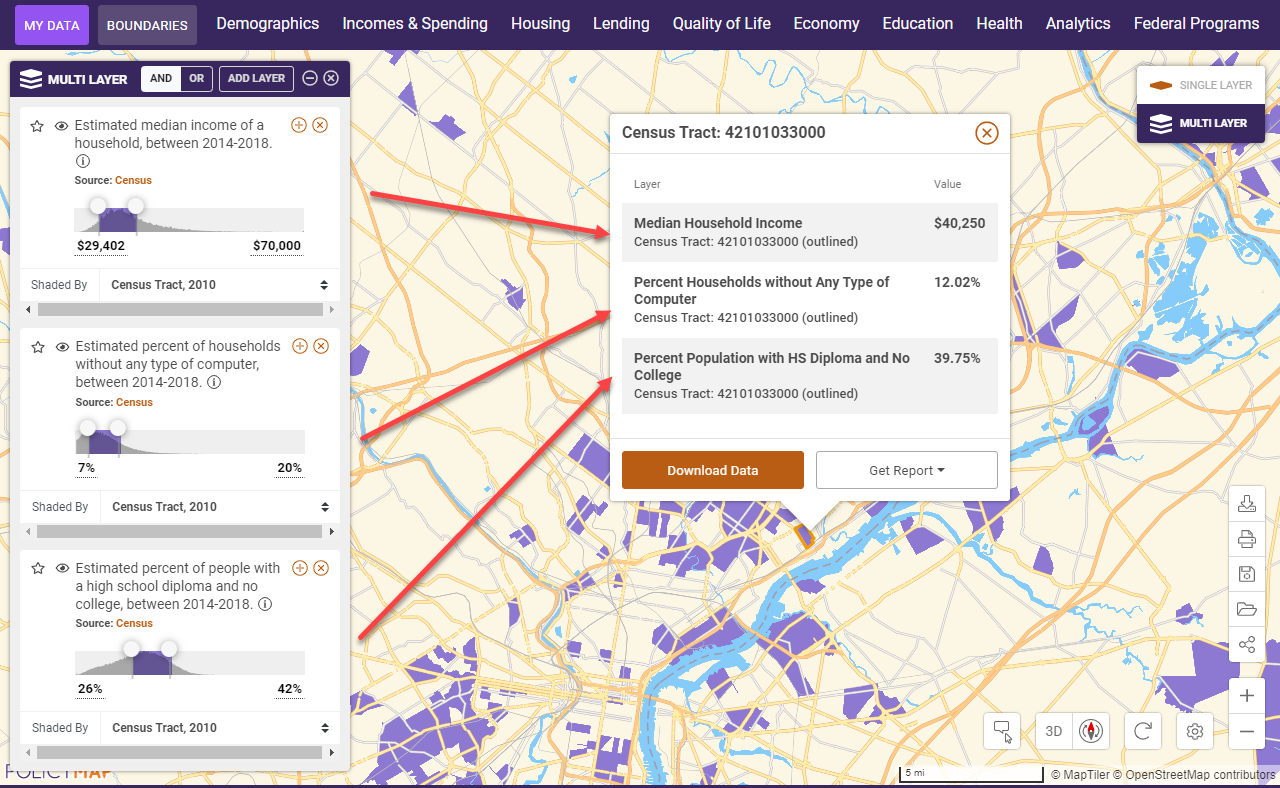
When you load the first data layer, the map will be completely purple. This is because the map is showing the entire range for the data layer loaded. You can set a specific range by moving the sliders or entering values in the legend. The map will then shade only those places that meet the parameters.
Click the  icon in the legend to access the edit options. Users can change the year, variable, and shade by for each data layer.
Add another data layer
Again, use the data menu or data search bar to add an additional data layer to the map and legend. The areas shaded in purple now match the parameters set for the first data layer, while also showing the complete range of the new data layer. Use the legend to adjust the ranges for the new data layer.
- Continue to add additional data layers to the map and edit the ranges for each data layer. Use the
 icon to remove data layers.
Click on a shaded area on the map to see values that match the criteria set in the legend. Users can also select places that are not shaded to see if the data layer did or did not match.
Add point datasets
Add a point dataset to see locations that fall in and outside of the shaded areas.